Fig. 10
Download original image
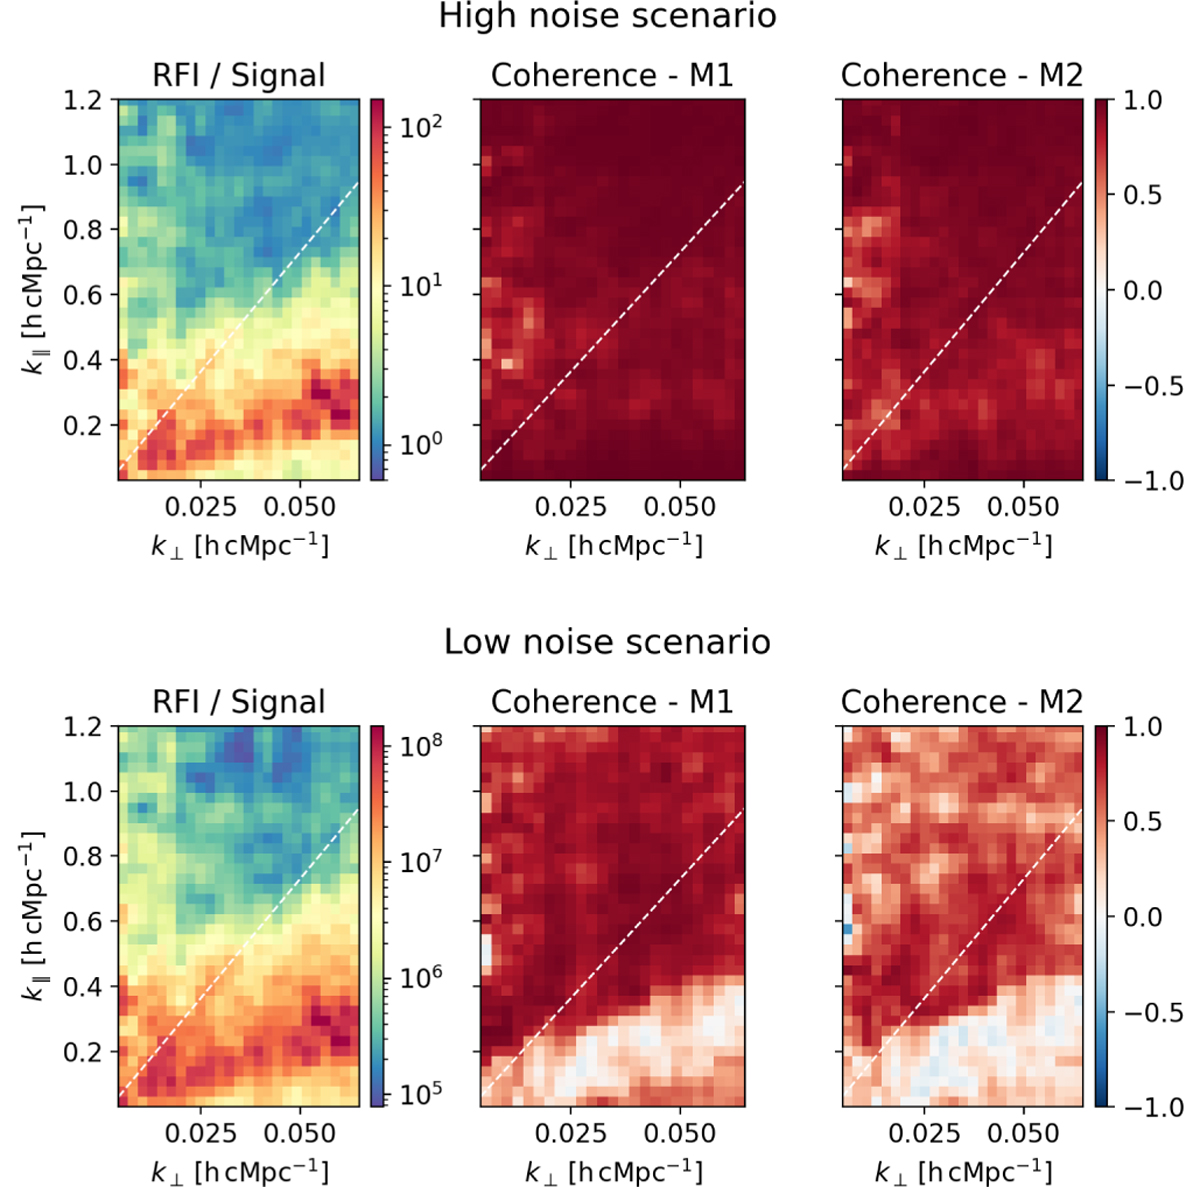
Results of robustness tests performed for the MAP spectrum estimation. The top row corresponds to the high noise and boosted signal scenario, while the bottom row corresponds to a low noise and standard signal scenario. The left column shows the dynamic range between the input RFI and 21 cm signal power spectrum in each scenario. The second and third columns show the cross-coherence between the noise-realization-subtracted residual Stokes I data against the input signal corresponding to the two methods M1 (RFI spectrum estimation from Stokes V) and M2 (RFI spectrum estimation from Stokes I). The white dashed lines indicate the horizon limit.
Current usage metrics show cumulative count of Article Views (full-text article views including HTML views, PDF and ePub downloads, according to the available data) and Abstracts Views on Vision4Press platform.
Data correspond to usage on the plateform after 2015. The current usage metrics is available 48-96 hours after online publication and is updated daily on week days.
Initial download of the metrics may take a while.