Fig. 1
Download original image
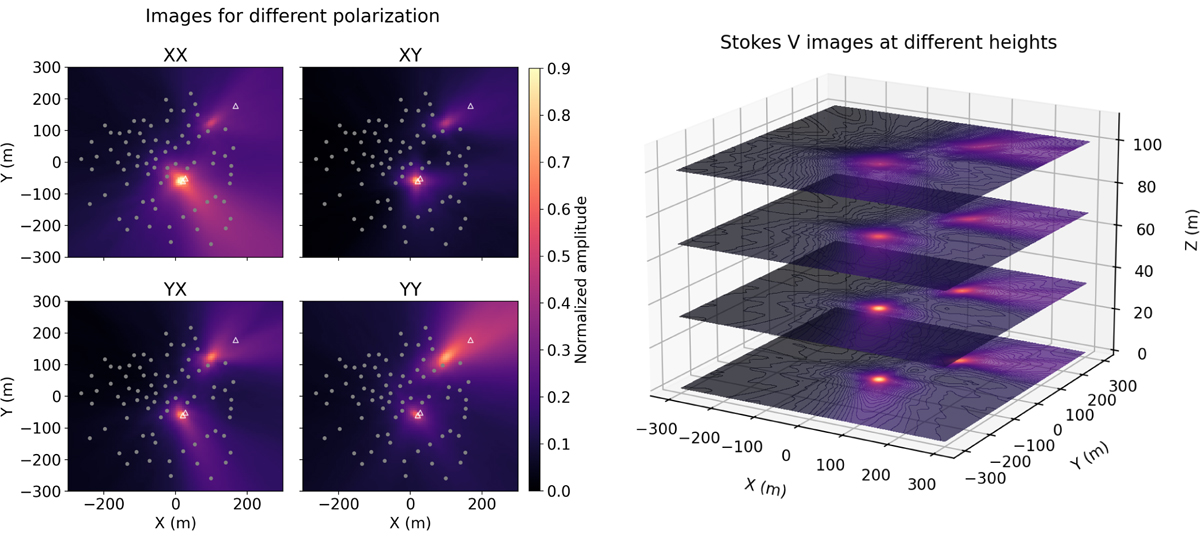
Near-field images of simulated datasets, constructed using the matched filter technique. The left panel shows the effect of instrumental polarization on the near-field images estimated per correlation. The gray dots indicate the locations of NenuFAR core stations, and the white hollow triangles indicate the locations of the three buildings within NenuFAR. The right panel shows images made at different heights above the ground.
Current usage metrics show cumulative count of Article Views (full-text article views including HTML views, PDF and ePub downloads, according to the available data) and Abstracts Views on Vision4Press platform.
Data correspond to usage on the plateform after 2015. The current usage metrics is available 48-96 hours after online publication and is updated daily on week days.
Initial download of the metrics may take a while.