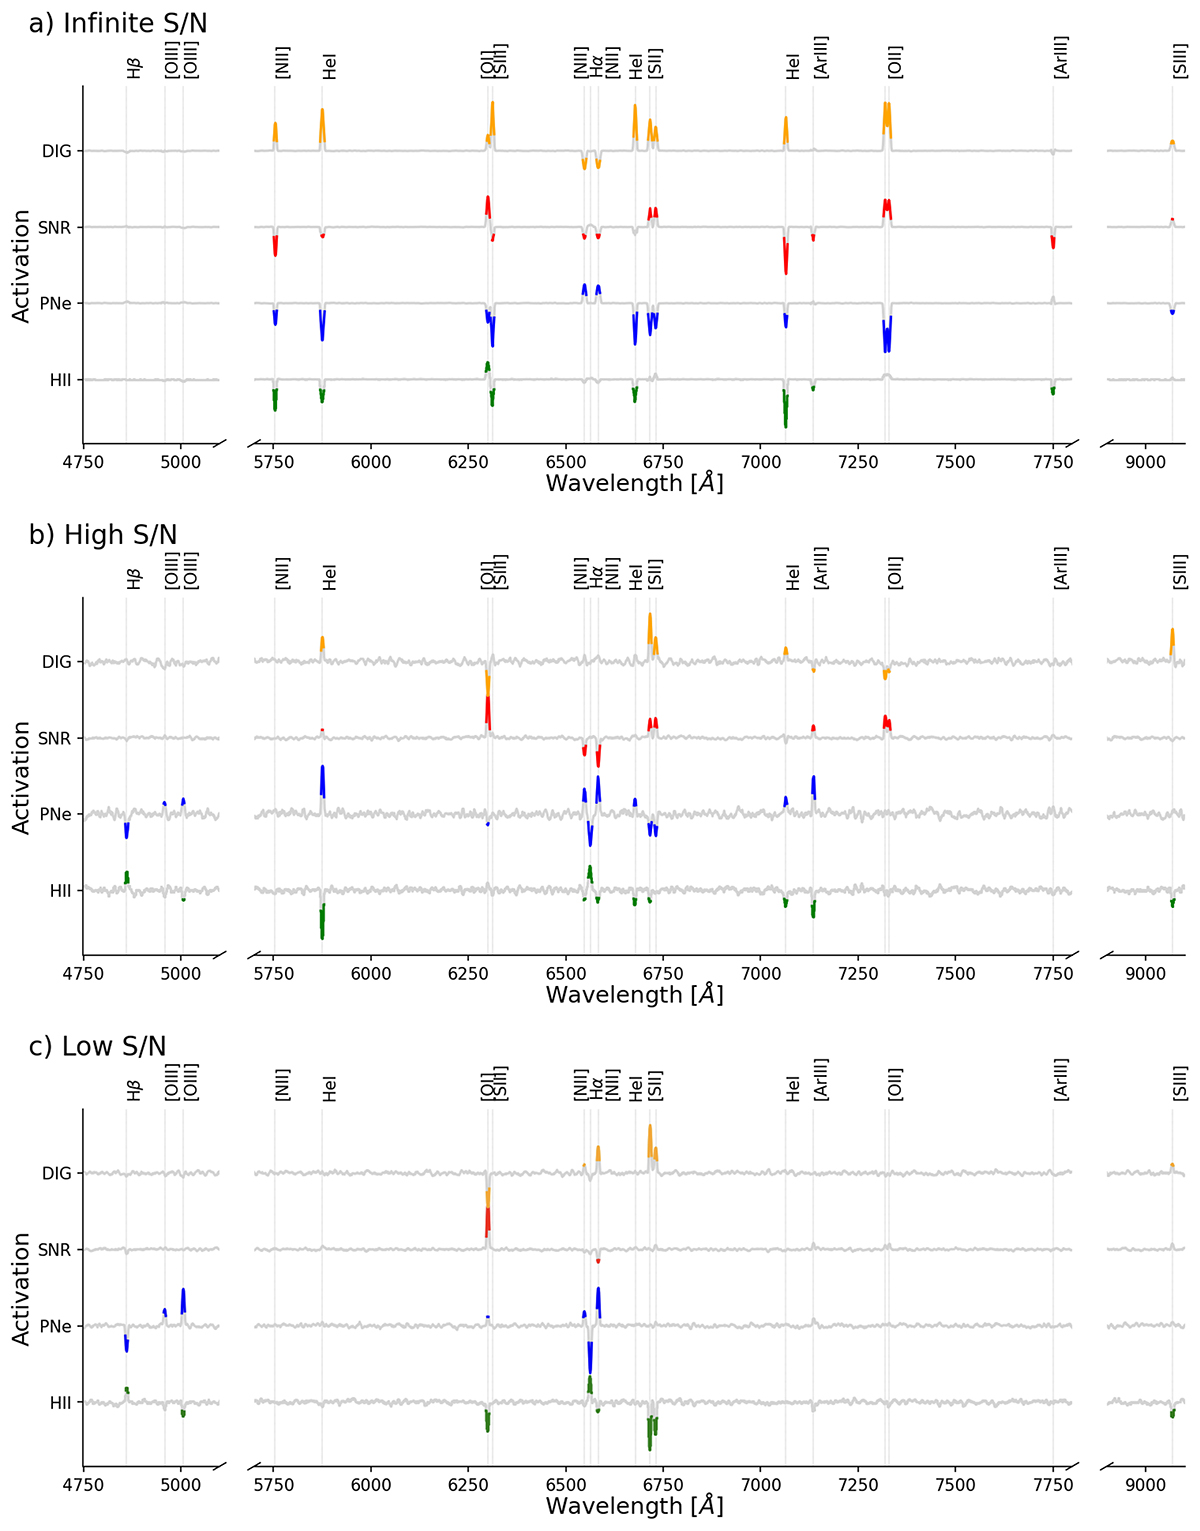
Fig. 9.
Download original image
Activation maximisation maps corresponding to three different mock datasets with different S/N for the four different classes of nebulae. For ease of visualisation, we show in colour the spectral channels where the absolute value of the activation is larger than 15% of the maximum value of the activation spectrum. The key emission lines are labelled. Panel a: activation map for the network trained with mock spectra with infinite S/N. Panel b: The high S/N mock spectra case. Panel c: the low S/N spectra case.
Current usage metrics show cumulative count of Article Views (full-text article views including HTML views, PDF and ePub downloads, according to the available data) and Abstracts Views on Vision4Press platform.
Data correspond to usage on the plateform after 2015. The current usage metrics is available 48-96 hours after online publication and is updated daily on week days.
Initial download of the metrics may take a while.