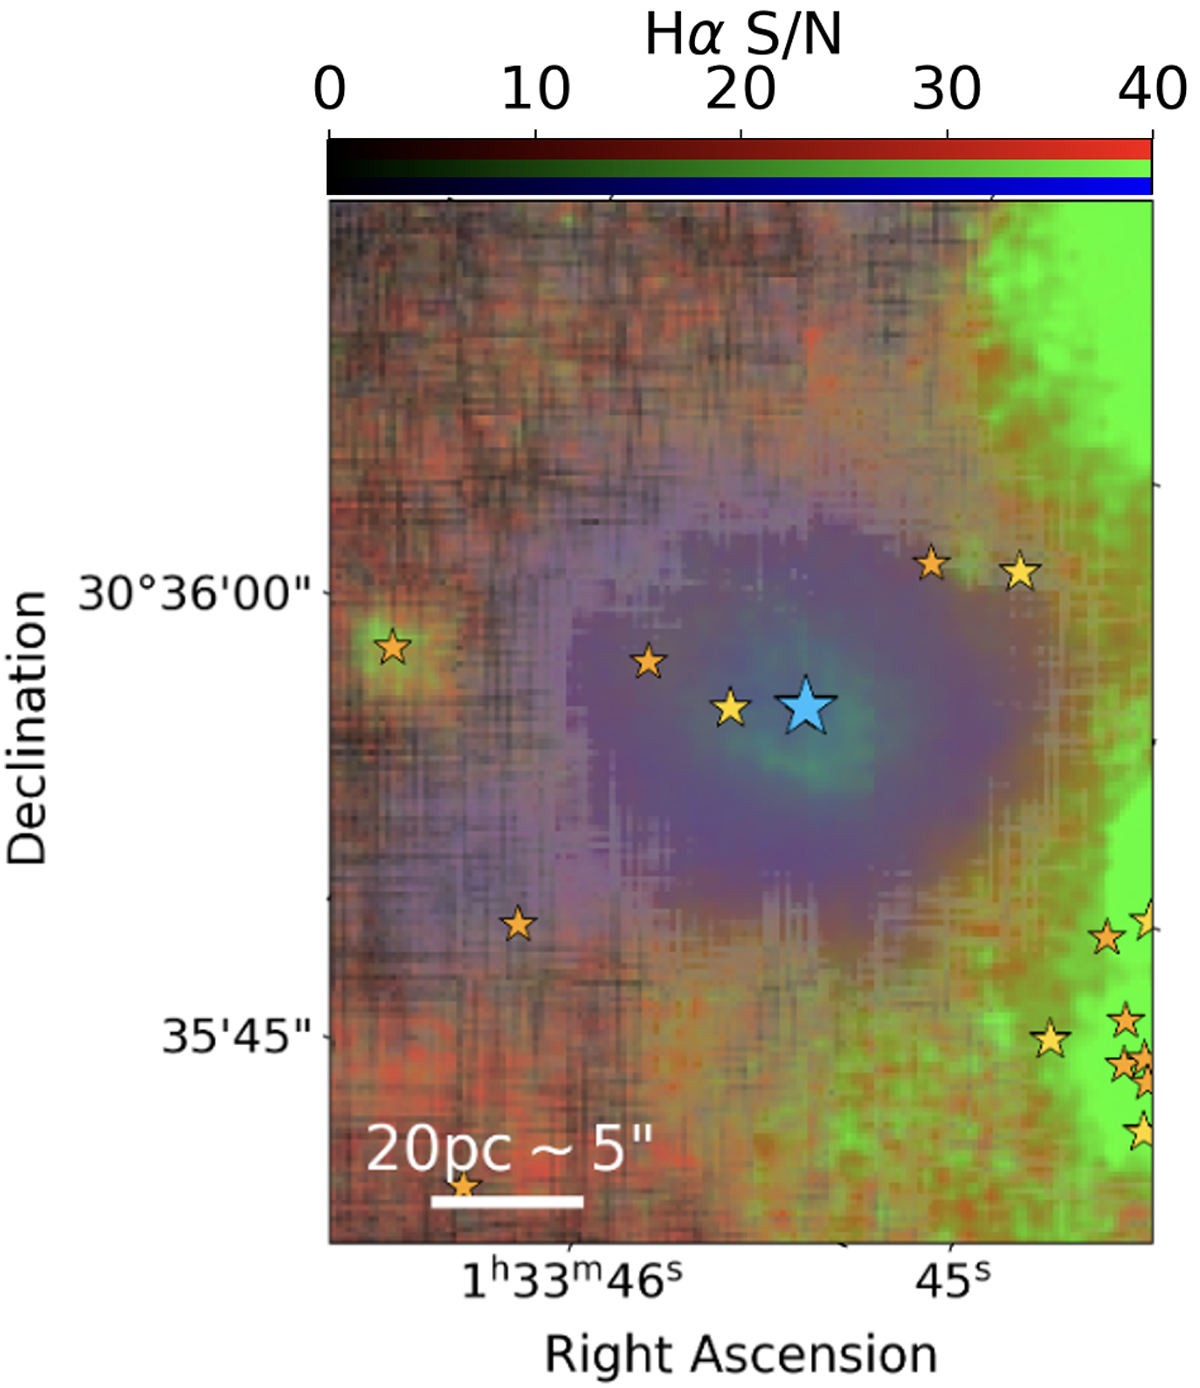
Fig. 8.
Download original image
Cutout of the classification map focusing on an [O III]λ5007 bright H II region hosting a Wolf-Rayet star (Neugent & Massey 2011), marked by the light blue star symbol. The colours in the map quantitatively represent the predicted contribution to each pixel’s spectra from an H II region (green scale), a PN (blue), and a SNR/DIG (red). We overlay a S/N map (in shades of grey). The additional star symbols in yellow and gold represent massive stars respectively brighter than 20 mag and between 21 and 20 mag in the F475W HST filter (Williams et al. 2021).
Current usage metrics show cumulative count of Article Views (full-text article views including HTML views, PDF and ePub downloads, according to the available data) and Abstracts Views on Vision4Press platform.
Data correspond to usage on the plateform after 2015. The current usage metrics is available 48-96 hours after online publication and is updated daily on week days.
Initial download of the metrics may take a while.