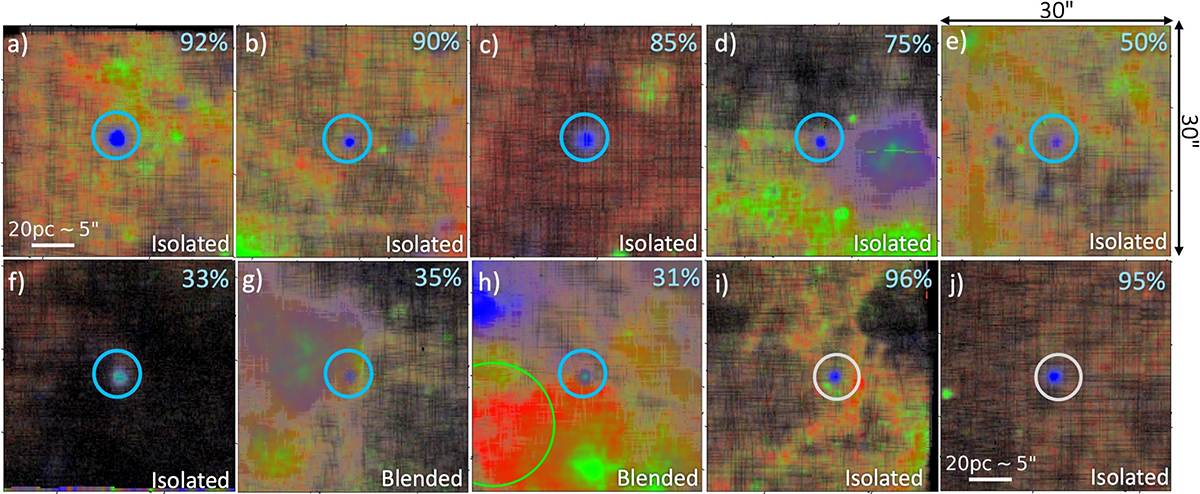
Fig. 7.
Download original image
Cutouts of the classification map focusing on the Ciardullo et al. (2004) PNe, identified by the light blue circles (panels a–h) and two additionally identified PNe, marked in grey (panels i, j). Each colour of the RBG map quantitatively represents the predicted contribution to each pixel’s spectra from an H II region (G), a PN (B), and a SNR/DIG (R). We overlay a S/N map (in shades of grey), derived from the Hα flux map and its associated error map. On the top right of each cutout, we write the PN contribution for the identified PNe averaged over an aperture of 1.5″ of diameter centred on the probability peak. On the bottom left, we specify whether the PN is isolated or its emission appears to be blended to that of other regions. The green circle in panel h marks a nearby SNR from the Lee & Lee (2014) and Long et al. (2018) catalogues.
Current usage metrics show cumulative count of Article Views (full-text article views including HTML views, PDF and ePub downloads, according to the available data) and Abstracts Views on Vision4Press platform.
Data correspond to usage on the plateform after 2015. The current usage metrics is available 48-96 hours after online publication and is updated daily on week days.
Initial download of the metrics may take a while.