Fig. 5.
Download original image
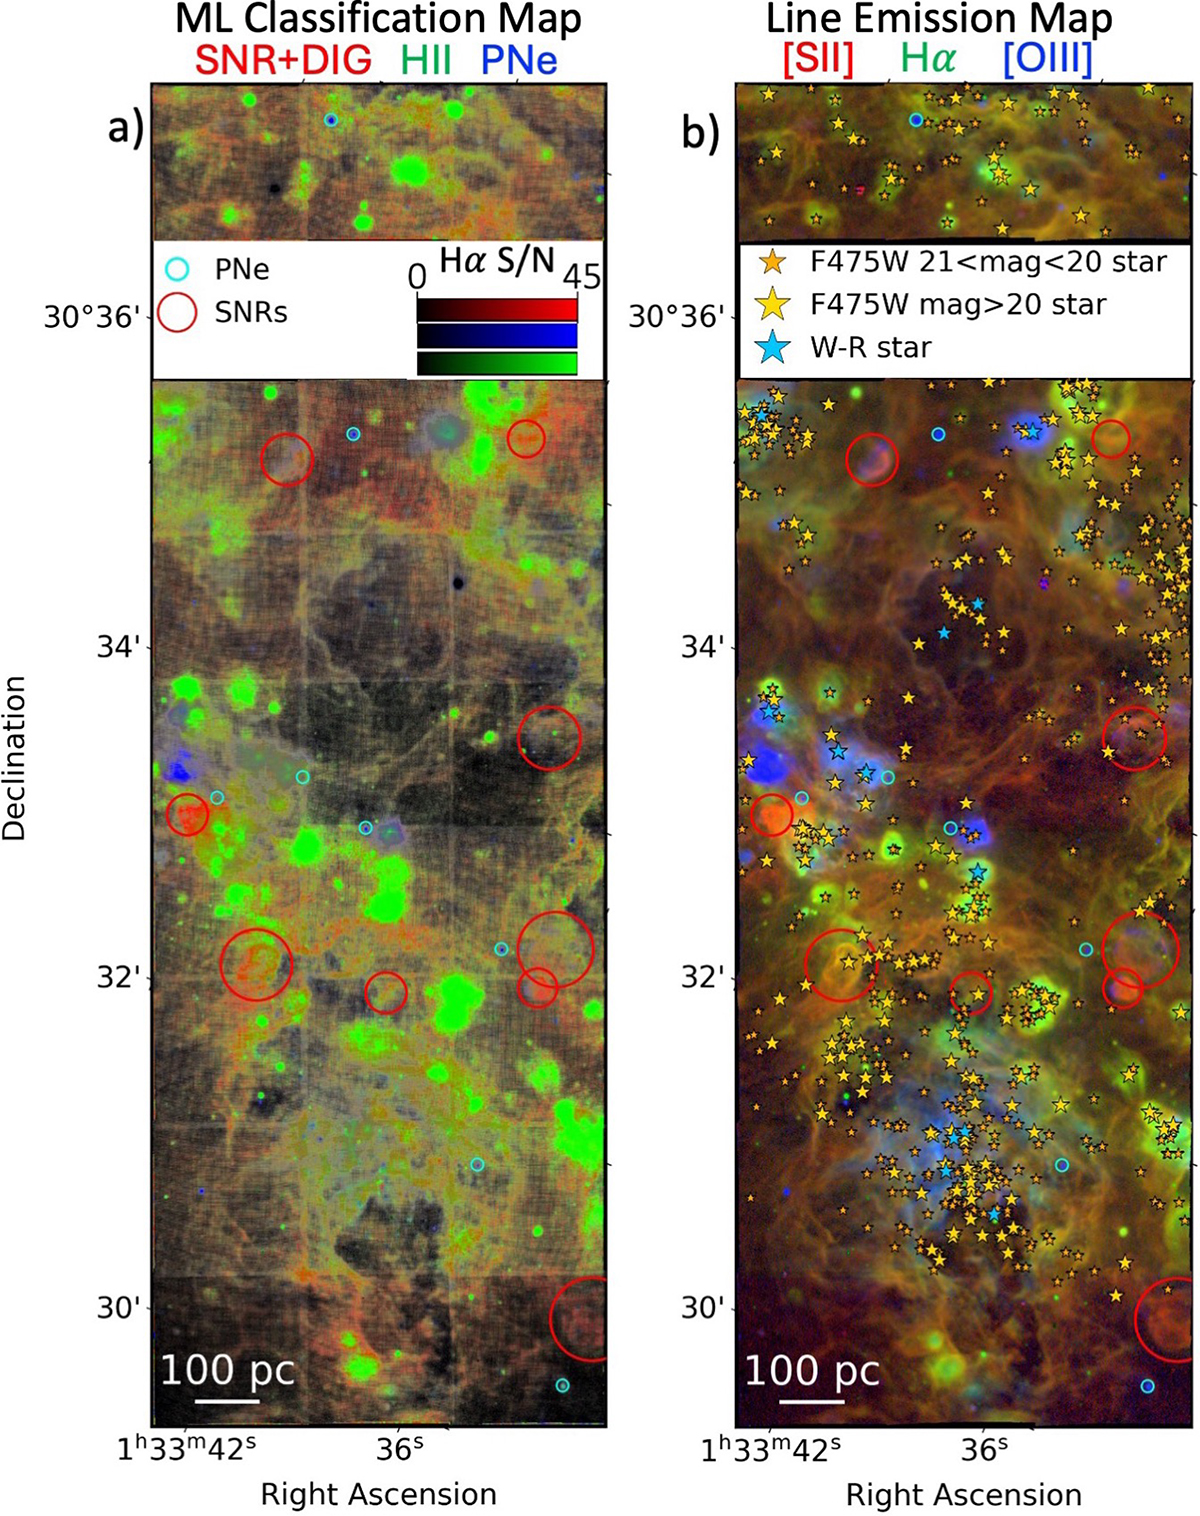
Comparison between the neural network classification of the single-spaxel spectra and a map of three key emission lines. On the left side (panel a), we show our neural network’s prediction map for the observed field of M33. Each colour quantitatively represents the predicted contribution to each pixel’s spectra from an H II region (green), a PN (blue), and a SNR plus DIG (red). We overlay a S/N map (in shades of grey), derived from the Hα flux map and its associated error map. On the right side (panel b), we show an RGB map of three key emission lines for the entire observed field of M33, with the red scale representing the [S II]λ6716, 6731 flux, the blue the [O III]λ5007 flux, and the green the Hα flux. The gold star symbols mark massive stars brighter than 20 mag in the F475W Hubble Space Telescope (HST) filter and the smaller orange stars those with magnitude between 21 and 20 in the same filter from Williams et al. (2021). The light blue star symbols mark Wolf-Rayet stars (Neugent & Massey 2011). In both images, the red circles mark SNRs from the Lee & Lee (2014) and Long et al. (2018) catalogues, while the smaller teal circles show the PNe selected by Ciardullo et al. (2004).
Current usage metrics show cumulative count of Article Views (full-text article views including HTML views, PDF and ePub downloads, according to the available data) and Abstracts Views on Vision4Press platform.
Data correspond to usage on the plateform after 2015. The current usage metrics is available 48-96 hours after online publication and is updated daily on week days.
Initial download of the metrics may take a while.