Fig. 4.
Download original image
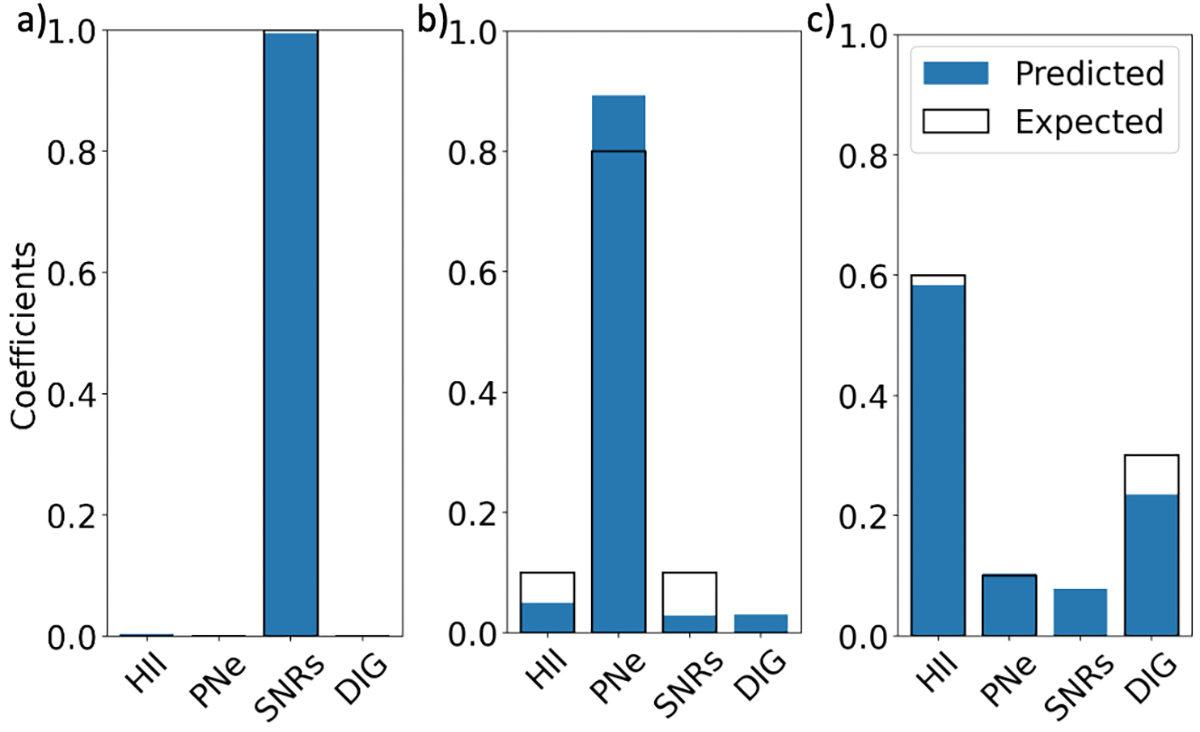
Bar plots showing the median error made by the network trained on the multi-label dataset on each class contribution for three example instances. The coloured bars represent the network’s prediction, while the empty bars are the true labels. In panel a, we show the classification of a single-label PNe spectrum, whose coefficients are accurately predicted. In panel b, we show the results for a multi-label instance, with a prevalent contribution of DIG > 60%. In panel c, we show the results for another multi-label instance, with a prevalent contribution of H II region = 60%.
Current usage metrics show cumulative count of Article Views (full-text article views including HTML views, PDF and ePub downloads, according to the available data) and Abstracts Views on Vision4Press platform.
Data correspond to usage on the plateform after 2015. The current usage metrics is available 48-96 hours after online publication and is updated daily on week days.
Initial download of the metrics may take a while.