Fig. 2.
Download original image
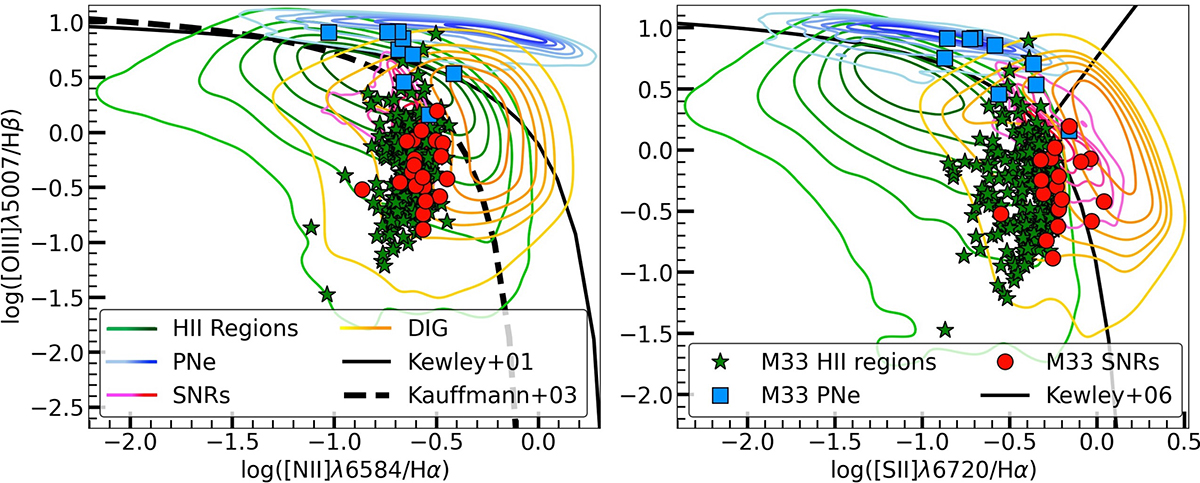
Two diagnostic diagrams ([N II]-BPT, Baldwin et al. 1981; [S II]-BPT, Veilleux & Osterbrock 1987) illustrating the relative positions of the emission-line region models and the observed nebulae in M33 across three different line ratio spaces. Green stars mark the identified M33 H II regions, blue squares the M33 PNe, and red circles the M33 SNRs. Similarly, green contours show the H II regions models, blue ones the PN models, pink-red ones the SNR models, and yellow-orange ones the DIG models. On the left, the [N II]-BPT diagram (Baldwin et al. 1981) includes the Kewley et al. (2001) and Kauffmann et al. (2003) (dashed line) diagnostic lines. On the right, the [S II]-BPT diagram includes the Kewley et al. (2006) diagnostic line.
Current usage metrics show cumulative count of Article Views (full-text article views including HTML views, PDF and ePub downloads, according to the available data) and Abstracts Views on Vision4Press platform.
Data correspond to usage on the plateform after 2015. The current usage metrics is available 48-96 hours after online publication and is updated daily on week days.
Initial download of the metrics may take a while.