Fig. B.2.
Download original image
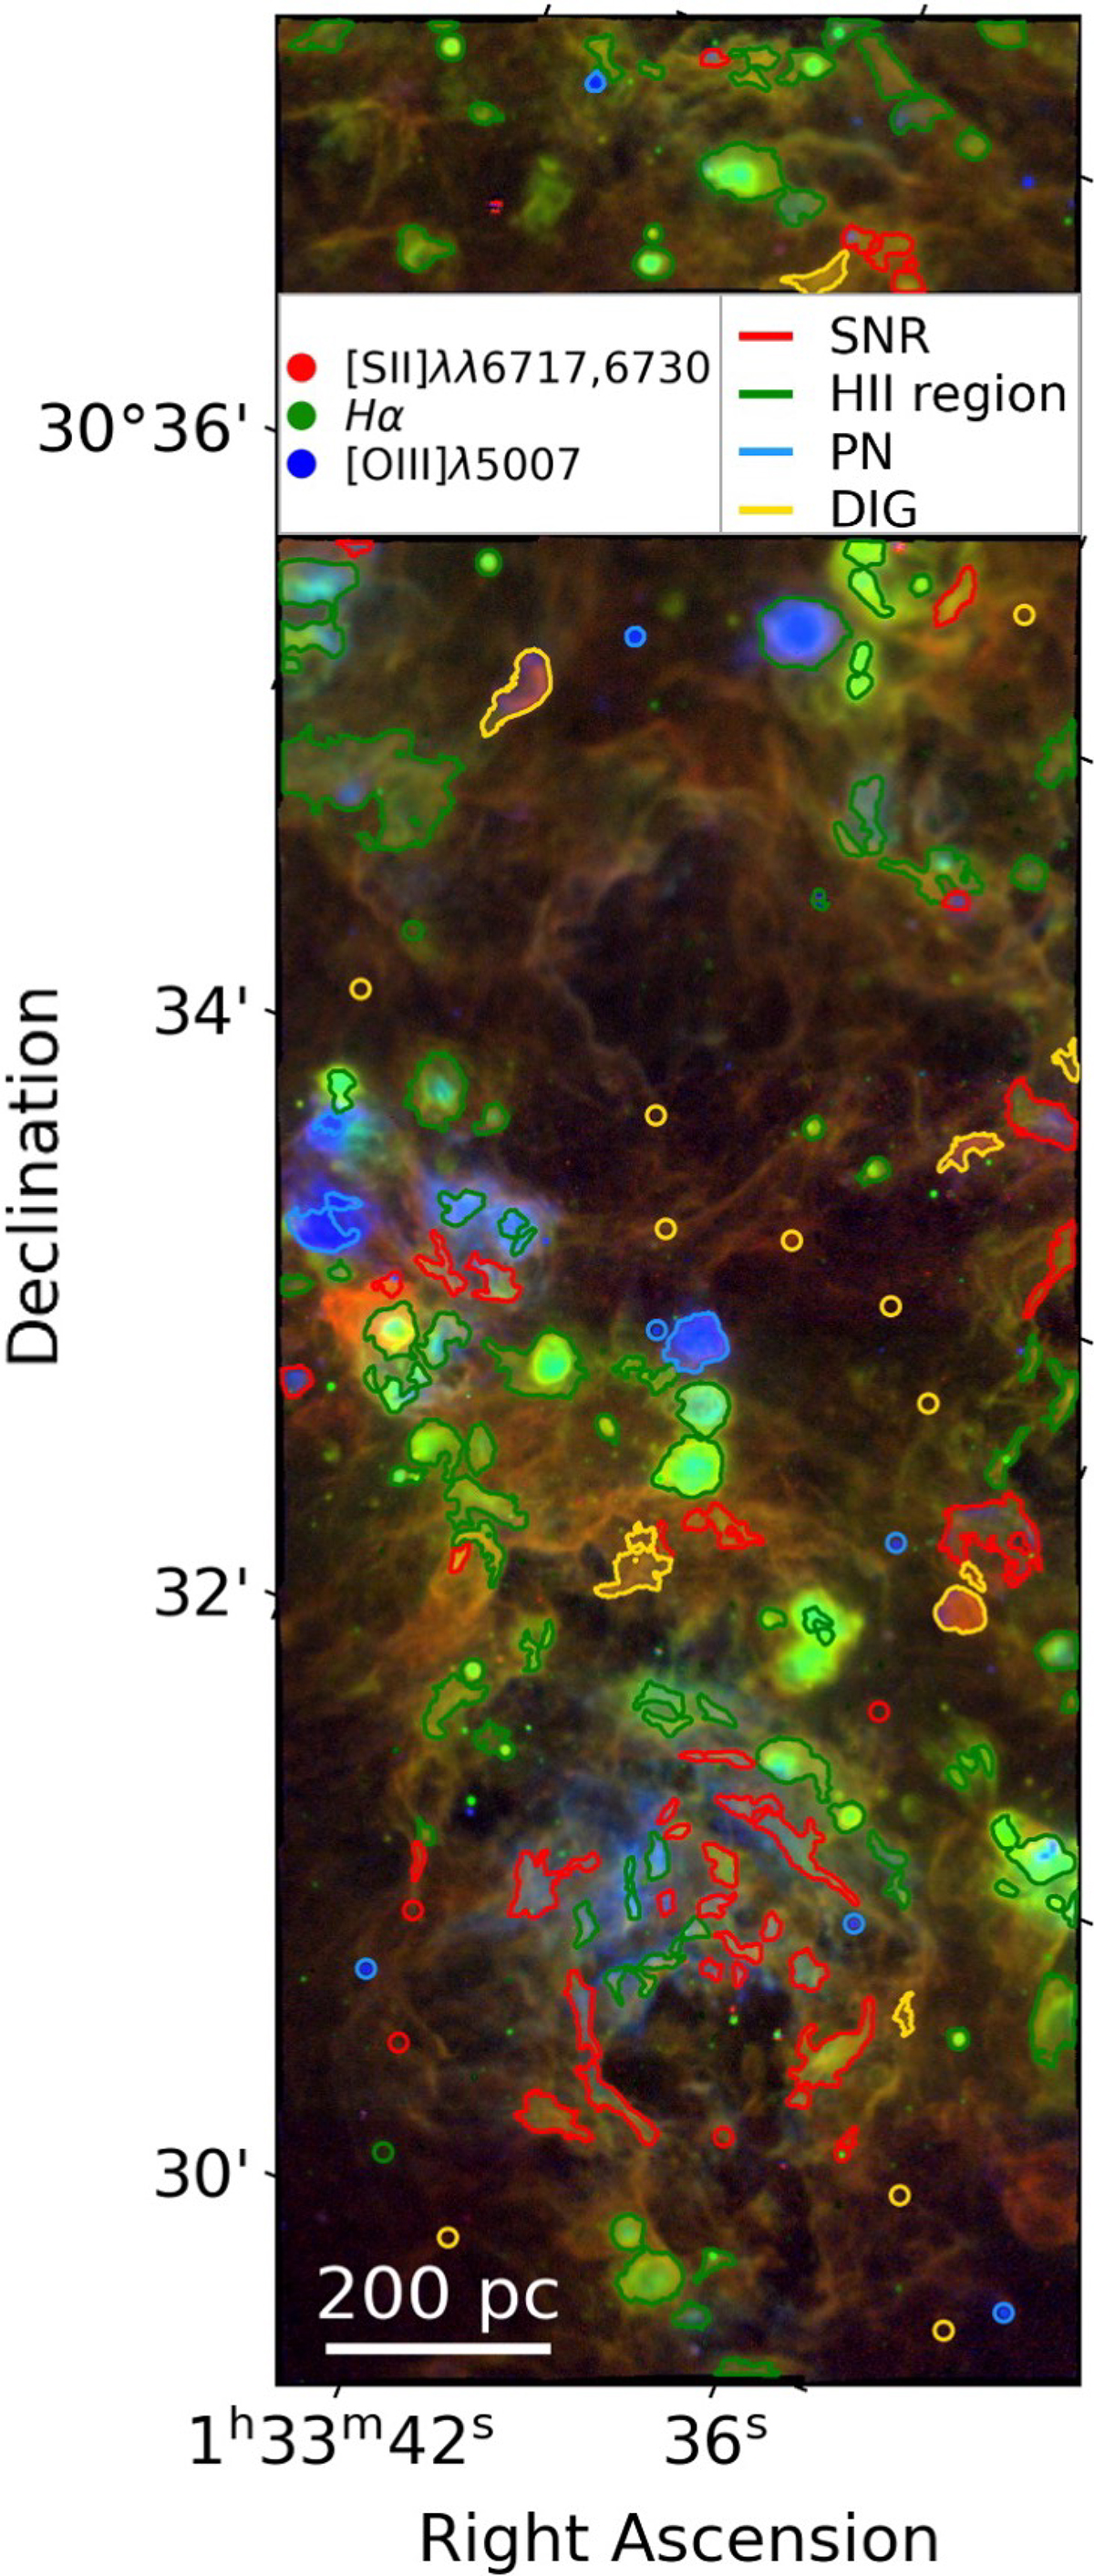
Map of the observed field of M33 showing the regions for the extraction of the integrated spectra and their neural network classification. We show the RGB map of three key emission lines for the entire observed field of M33, with the red scale representing the [S II]λ6716, 6731 flux, the blue the [O III]λ5007 flux, and the green the Hα flux. On top of this, we mark the contours of the regions of spectrum extraction coloured based on the model’s classification: green for H II region, blue for PNe, red for SNRs, and gold for DIG.
Current usage metrics show cumulative count of Article Views (full-text article views including HTML views, PDF and ePub downloads, according to the available data) and Abstracts Views on Vision4Press platform.
Data correspond to usage on the plateform after 2015. The current usage metrics is available 48-96 hours after online publication and is updated daily on week days.
Initial download of the metrics may take a while.