Fig. 11.
Download original image
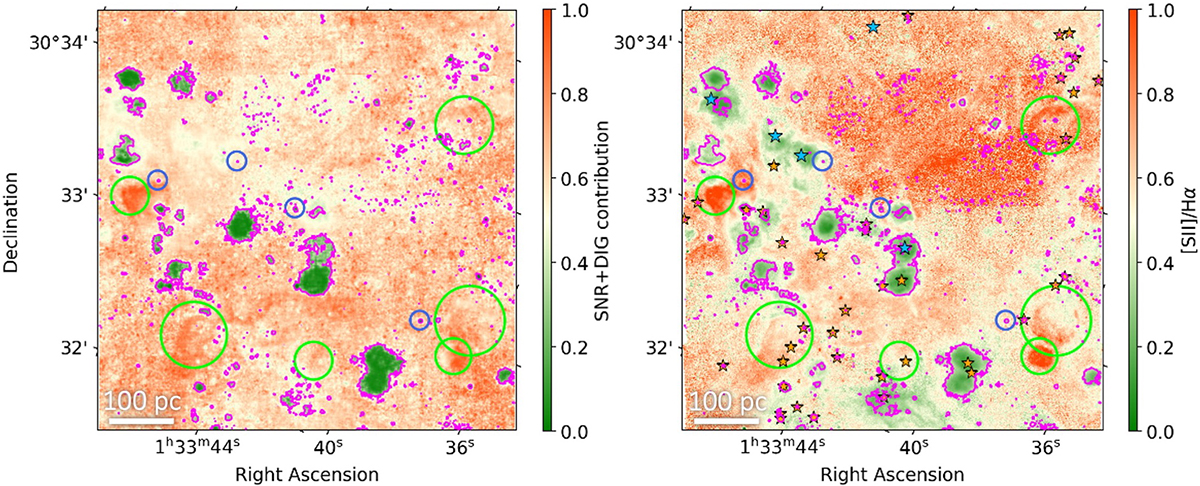
Comparison between the SNR+DIG neural network classification and the one with a traditional method from the literature for a section of the observed M33 field. On the left is the SNR+DIG contribution map as predicted by the network. Colours tending to red show a higher probability of SNR or DIG, while those tending to green a lower one. On the right, a map coloured based on the [S II]λ6716, 6731/Hα ratio. A higher value of the ratio suggests brighter [S II] emission with respect to Hα. The yellow star symbols mark O type ionising stars from Williams et al. (2021), selected based on flux and colour. Instead, the light blue ones mark Wolf-Rayet stars (Neugent & Massey 2011). In both images, the blue circles show the Ciardullo et al. (2004) PNe, while the green circles mark the Lee & Lee (2014) and Long et al. (2018) SNRs. The pink contours mark the points with a predicted SNR+DIG contribution of 0.6.
Current usage metrics show cumulative count of Article Views (full-text article views including HTML views, PDF and ePub downloads, according to the available data) and Abstracts Views on Vision4Press platform.
Data correspond to usage on the plateform after 2015. The current usage metrics is available 48-96 hours after online publication and is updated daily on week days.
Initial download of the metrics may take a while.