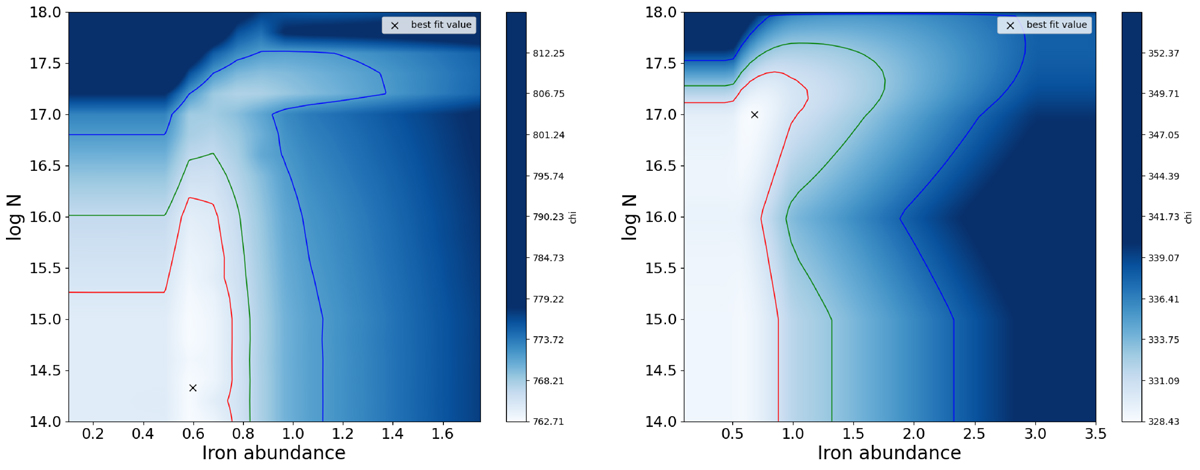
Fig. 5.
Download original image
Contour plots for the logarithmic electron density (log N) and the iron abundance of the disk obtained applying model 4 to October and April 16 data (left panel) and April 15 data (right panel). The contours represent the 1σ, 2σ, and 3σ confidence levels, and the cross marks the best-fit values obtained from the best fit. The axis limits have been rescaled for visual purposes.
Current usage metrics show cumulative count of Article Views (full-text article views including HTML views, PDF and ePub downloads, according to the available data) and Abstracts Views on Vision4Press platform.
Data correspond to usage on the plateform after 2015. The current usage metrics is available 48-96 hours after online publication and is updated daily on week days.
Initial download of the metrics may take a while.