Fig. 4.
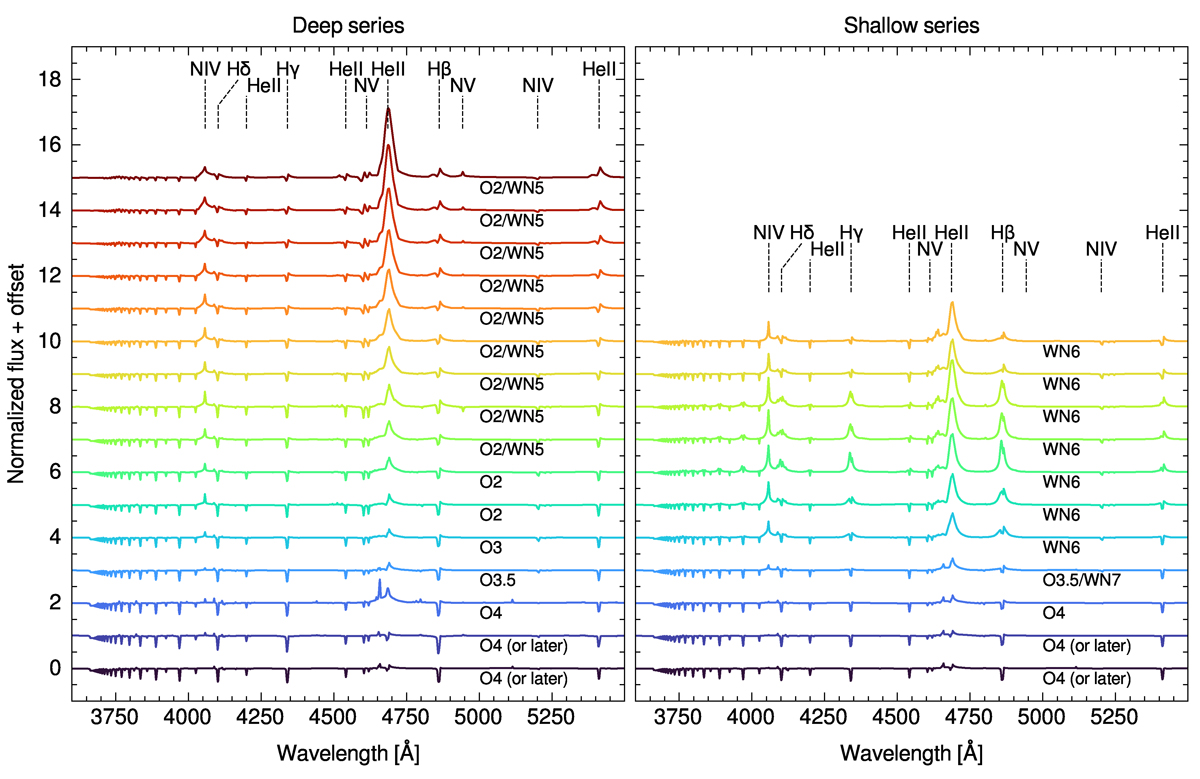
Download original image
Optical spectrum for deep (left) vs. shallow (right) models across evolution (from bottom to top). The spectra are vertically offset so that the continuum level corresponds to the grid point number on the y axis for easy reading. The spectral types were estimated based on the classification scheme in Crowther & Walborn (2011).
Current usage metrics show cumulative count of Article Views (full-text article views including HTML views, PDF and ePub downloads, according to the available data) and Abstracts Views on Vision4Press platform.
Data correspond to usage on the plateform after 2015. The current usage metrics is available 48-96 hours after online publication and is updated daily on week days.
Initial download of the metrics may take a while.