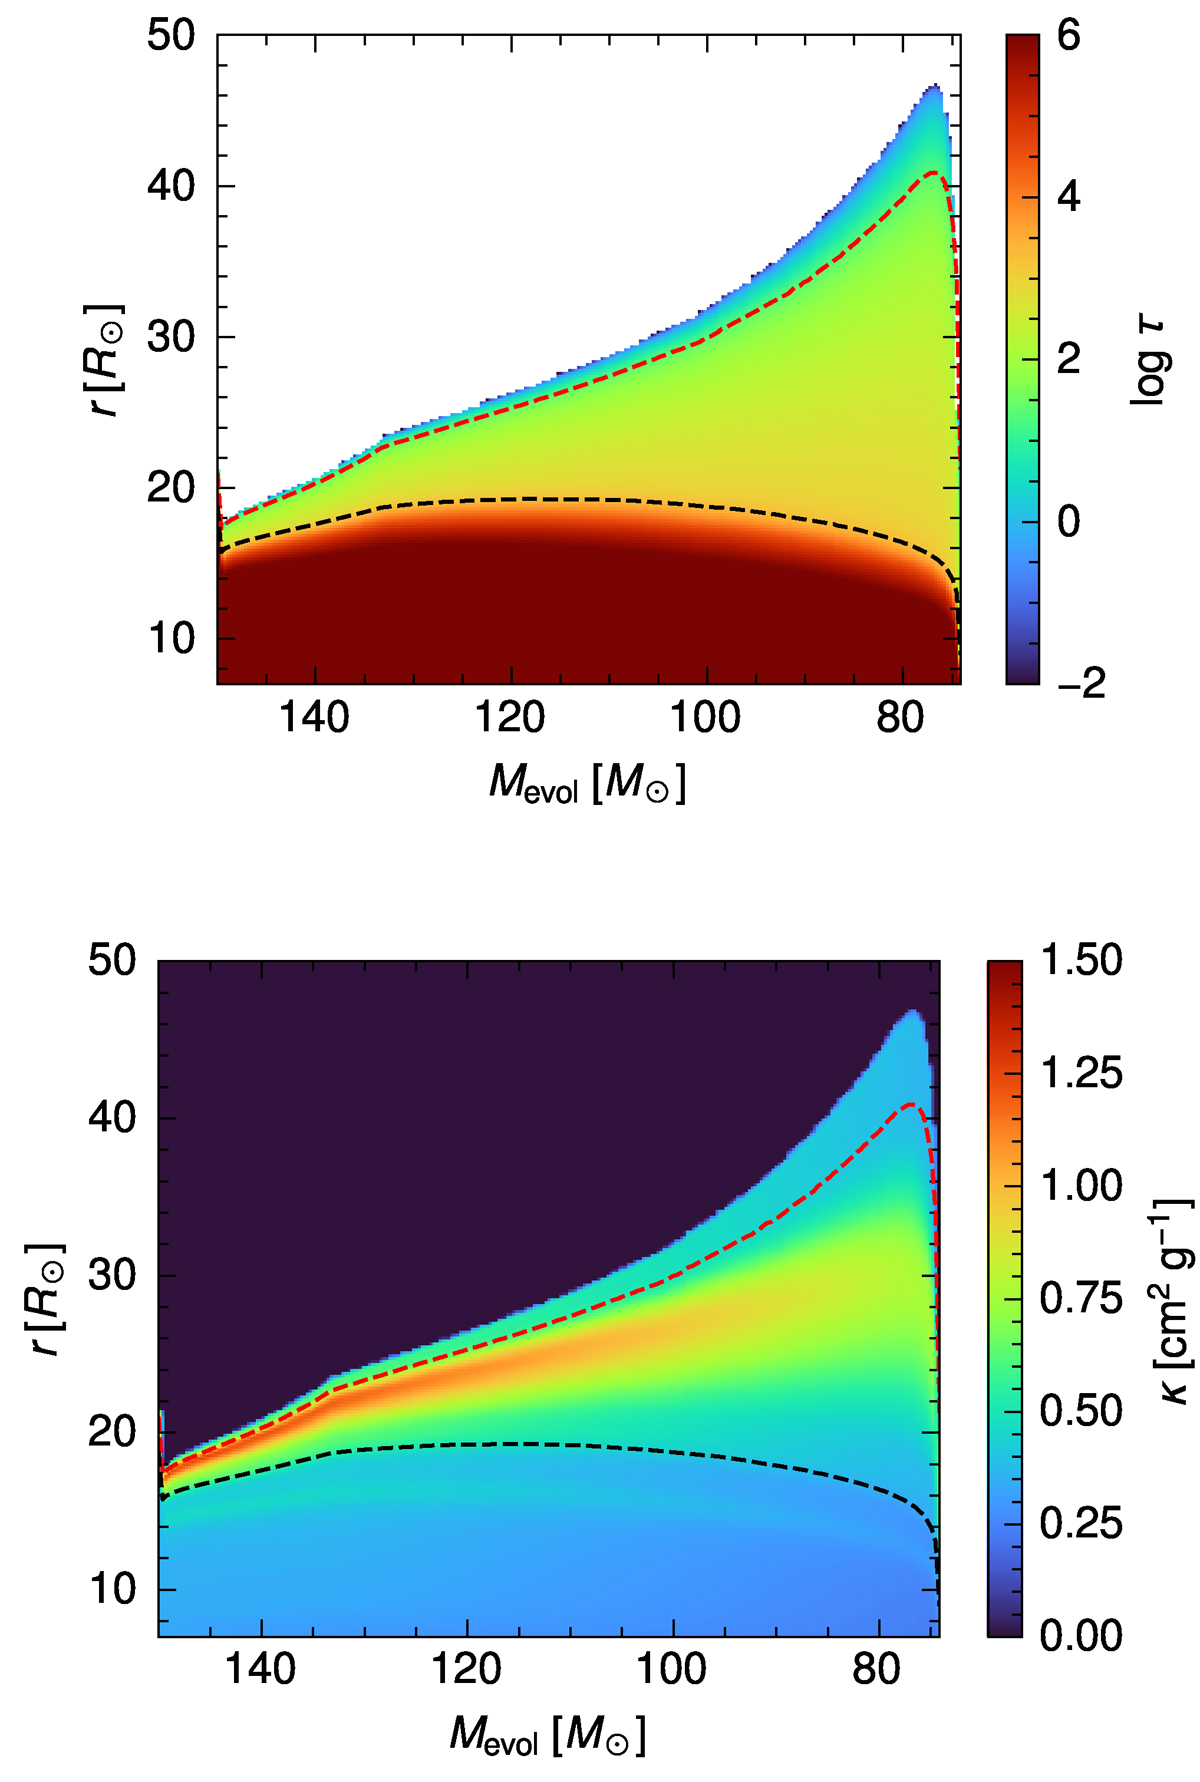
Fig. 3.
Download original image
Evolution of the interior atmospheric structure of the continuum optical depth (top) and the total Rosseland mean opacity (bottom) of a nonrotating 150 M⊙ star during the MS. The dashed red line shows the location of τ = 20, and the dashed black line marks a local density of 10−7 g cm−3. These represent the connection boundary for the atmosphere models outlined in Sect. 3.2.
Current usage metrics show cumulative count of Article Views (full-text article views including HTML views, PDF and ePub downloads, according to the available data) and Abstracts Views on Vision4Press platform.
Data correspond to usage on the plateform after 2015. The current usage metrics is available 48-96 hours after online publication and is updated daily on week days.
Initial download of the metrics may take a while.