Fig. 7
Download original image
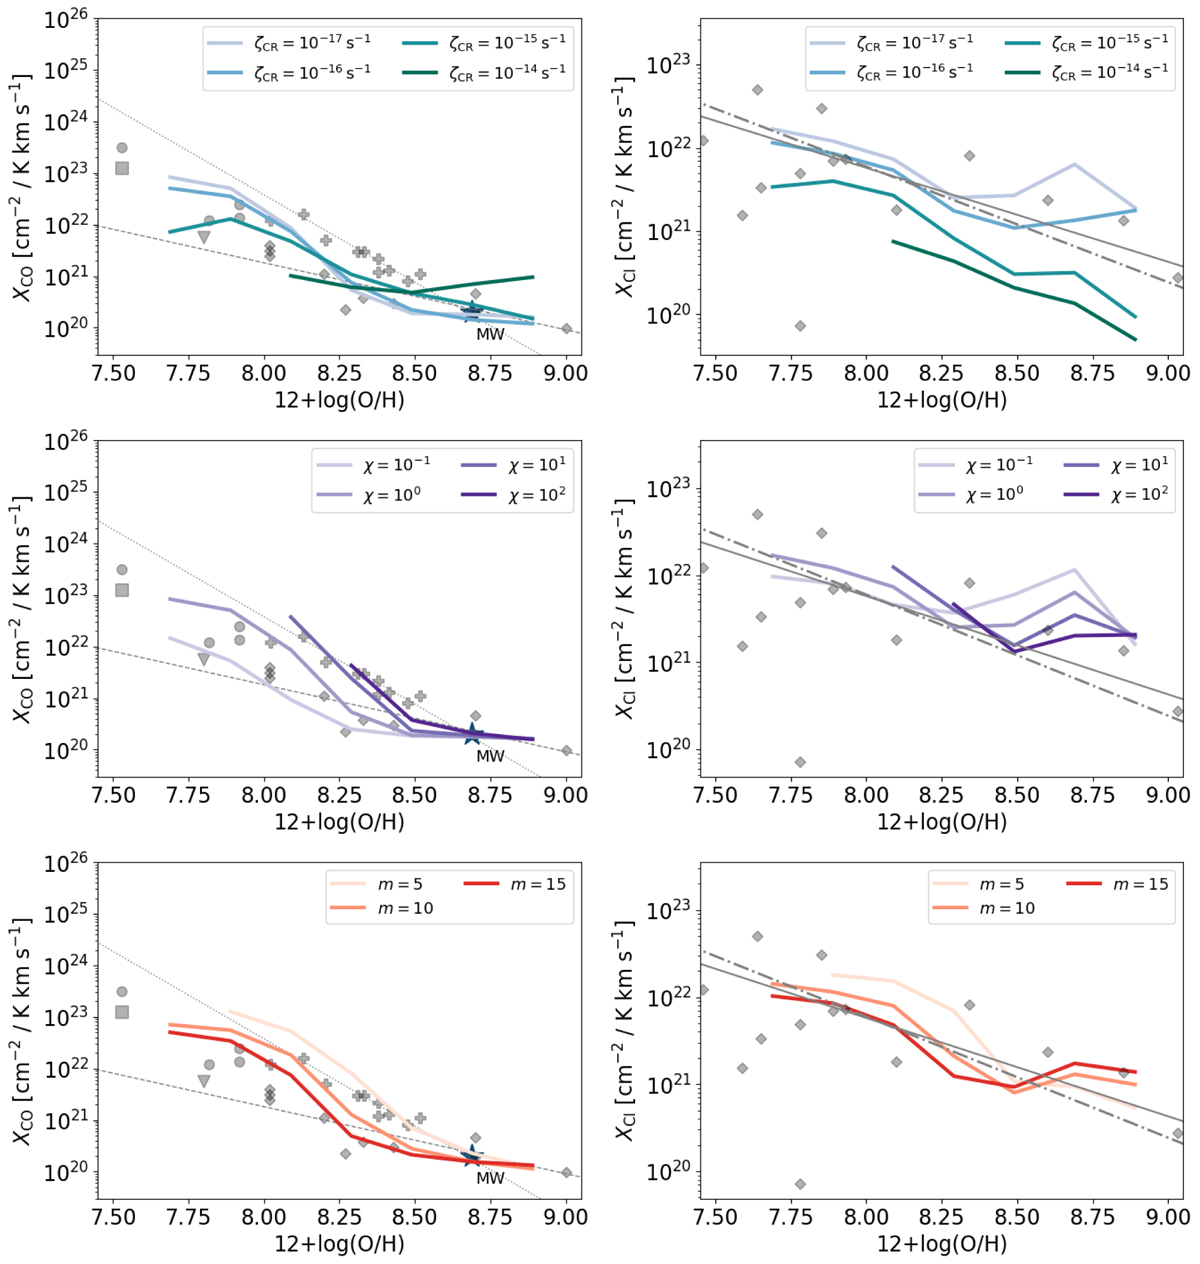
XCO (left column) and XCI (right column) conversion factors vs. metallicity as a function of the FUV intensity (top row), the cosmic-ray ionization rate (middle row), and the density distribution (bottom row). The panels in the top row illustrate the dependence on ζCR for a fixed FUV intensity of χ/χ0 = 1. The panels in the middle row show the dependence on χ/χ0 for a fixed ζCR = 10−17 s−1. In the top and middle rows, we consider all three m and three σ values (nine distributions in total) of Table 2. The panels in the bottom row illustrate the dependence on the mean, m, of the AV-PDF for a fixed σPDF = 0.4. The bottom panels are averages for 10−17 ≤ ζCR ≤ 10−15 s−1 and 0.5 ≤ χ/χ0 ≤ 102. In all panels, the gray scatter points and the gray lines correspond to the observations and best-fit relations described in Fig. 6.
Current usage metrics show cumulative count of Article Views (full-text article views including HTML views, PDF and ePub downloads, according to the available data) and Abstracts Views on Vision4Press platform.
Data correspond to usage on the plateform after 2015. The current usage metrics is available 48-96 hours after online publication and is updated daily on week days.
Initial download of the metrics may take a while.