Fig. 6
Download original image
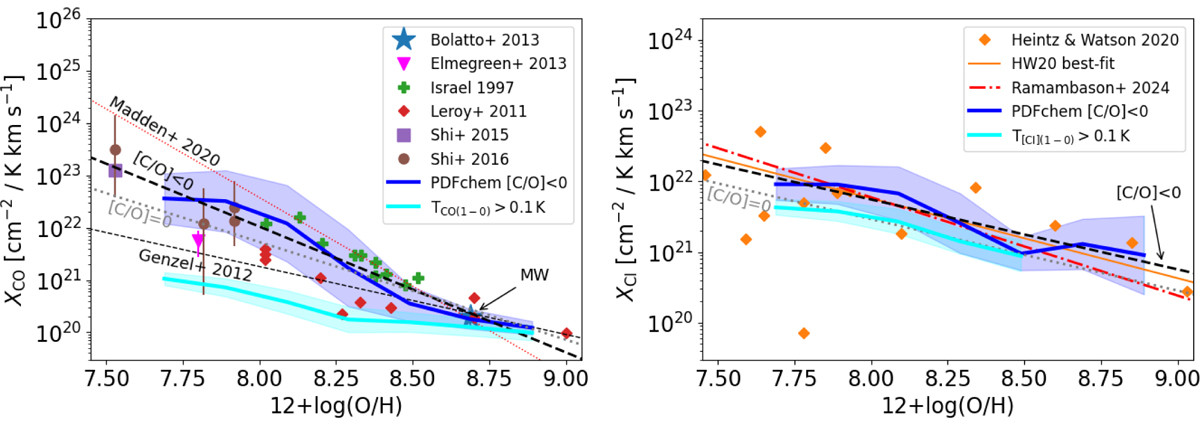
XCO-factor (left panel) and the XCI-factor (right panel) for all models (solid blue lines). The dashed black lines illustrate the best-fit expressions (Eqs. (7) and (8) for XCo and XCI, respectively). We show in the left panel the observations of Israel (1997); Leroy et al. (2011); Elmegreen et al. (2013); Shi et al. (2015, 2016), including the average MW value (shown as the large blue star (Bolatto et al. 2013)) and the best-fit relations of Genzel et al. (2012) and Madden et al. (2020). We show in the right panel the observations of Heintz & Watson (2020) and their best-fit relation together with that of Ramambason et al. (2024). For all scattered observational data, we plot the reported error bars, which may be smaller than the symbol size. In all cases, the PDFCHEM best-fit expressions match the observations well. In both panels, the case of [C/O] = 0 is shown as the dotted gray line, which further assumes the linear relation of ![]() with [O/H] (dotted lines in the panels of Fig. 1). The cyan lines show the conversion factors when we account for an observational sensitivity limit (0.1 K for the CO (1−0) and [CI] (1–0) lines). The shaded areas in the PDFCHEM models represent the 1σ standard deviation.
with [O/H] (dotted lines in the panels of Fig. 1). The cyan lines show the conversion factors when we account for an observational sensitivity limit (0.1 K for the CO (1−0) and [CI] (1–0) lines). The shaded areas in the PDFCHEM models represent the 1σ standard deviation.
Current usage metrics show cumulative count of Article Views (full-text article views including HTML views, PDF and ePub downloads, according to the available data) and Abstracts Views on Vision4Press platform.
Data correspond to usage on the plateform after 2015. The current usage metrics is available 48-96 hours after online publication and is updated daily on week days.
Initial download of the metrics may take a while.