Fig. 3
Download original image
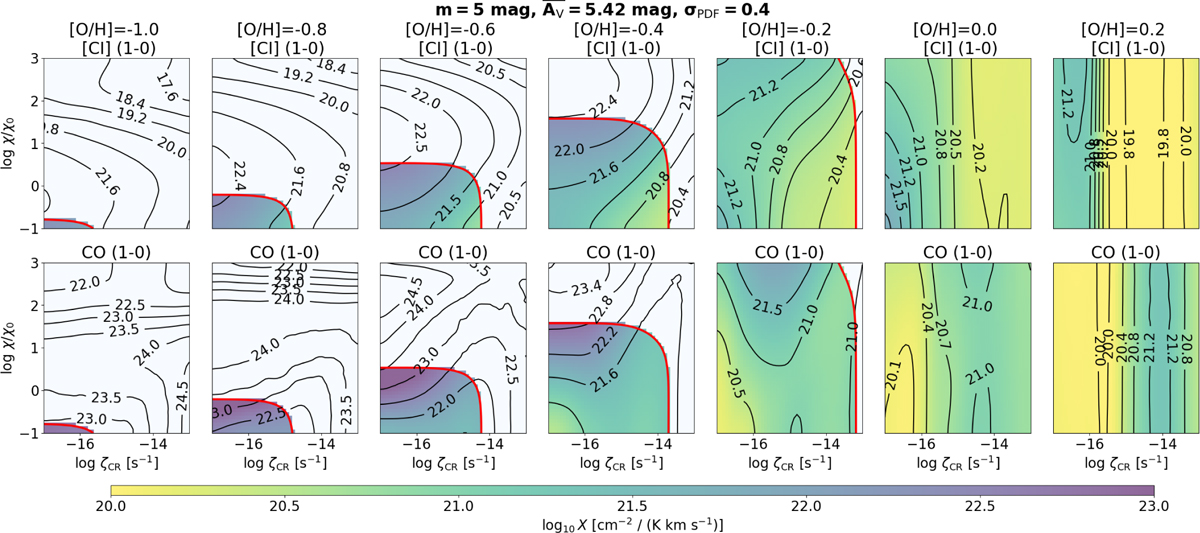
Logarithmic grid maps (in the common logarithmic space of log10) showing the X-conversion factors using the [CI] (1–0) (top) and the CO (1−0) (bottom), defined as the ratio of the PDF-averaged H2 column density to the PDF-averaged brightness temperature multiplied by the line width. These panels show results of the AV-PDF of m = 5 mag and σPDF = 0.4, corresponding to ![]() mag. Each column corresponds to different [O/H] ratios (left to right: −1.0 to 0.2 at a step of 0.2; see also Table 1 and Fig. 1). In all panels, the x-axis is the cosmic-ray ionization rate in the range of ζCR = 10−17−10−13 s−1, and the y-axis is the FUV intensity in the range of χ/χ0 = 10−1−103. The HI-to-H2 transition at which the condition HI = 2H2 is satisfied is shown as the solid red line. For ζCR−χ/χ0 pairs smaller than those corresponding to the red line, the distribution is molecular (H2 rich; colored partition), and otherwise, it is atomic (HI rich; white partition). For [O/H] = 0.0 and 0.2, the distribution is H2 rich for the entire range of ζCR and χ/χ0 we explored. The color bar shows the logarithm of the X-factor.
mag. Each column corresponds to different [O/H] ratios (left to right: −1.0 to 0.2 at a step of 0.2; see also Table 1 and Fig. 1). In all panels, the x-axis is the cosmic-ray ionization rate in the range of ζCR = 10−17−10−13 s−1, and the y-axis is the FUV intensity in the range of χ/χ0 = 10−1−103. The HI-to-H2 transition at which the condition HI = 2H2 is satisfied is shown as the solid red line. For ζCR−χ/χ0 pairs smaller than those corresponding to the red line, the distribution is molecular (H2 rich; colored partition), and otherwise, it is atomic (HI rich; white partition). For [O/H] = 0.0 and 0.2, the distribution is H2 rich for the entire range of ζCR and χ/χ0 we explored. The color bar shows the logarithm of the X-factor.
Current usage metrics show cumulative count of Article Views (full-text article views including HTML views, PDF and ePub downloads, according to the available data) and Abstracts Views on Vision4Press platform.
Data correspond to usage on the plateform after 2015. The current usage metrics is available 48-96 hours after online publication and is updated daily on week days.
Initial download of the metrics may take a while.