Fig. 2
Download original image
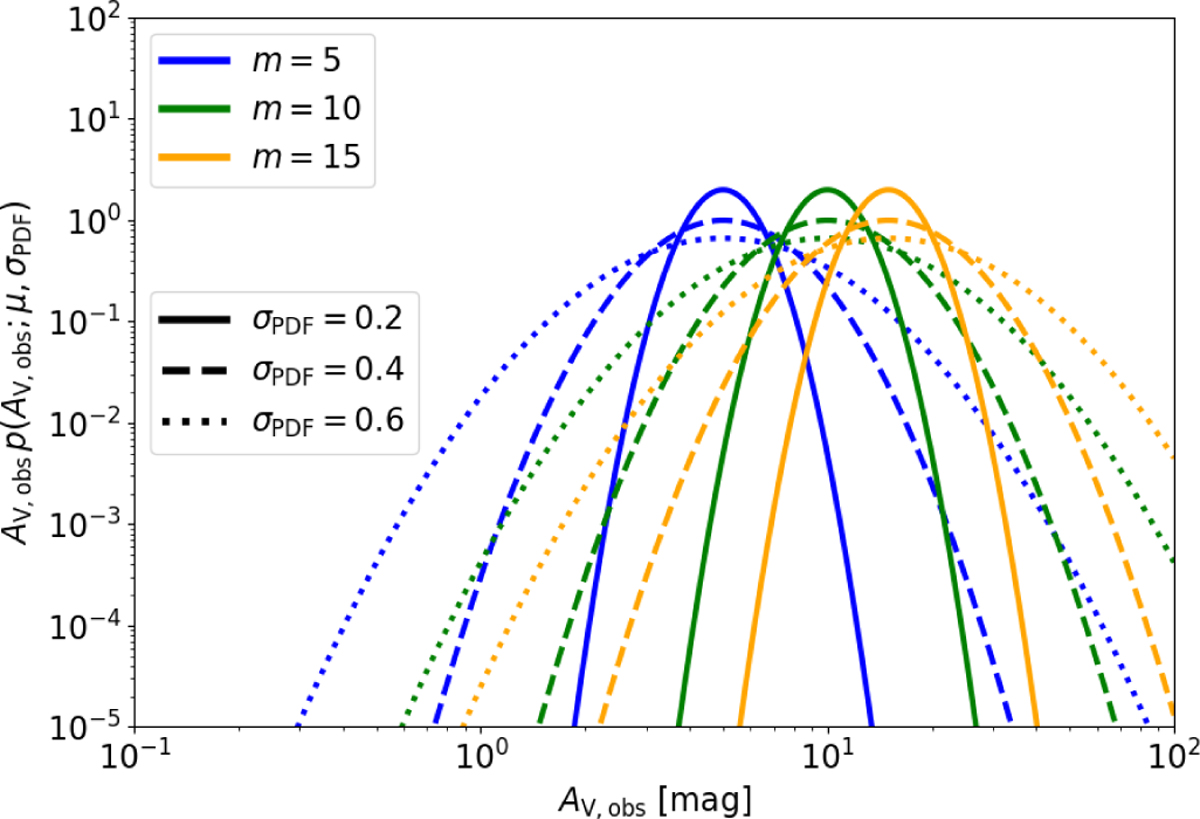
Input observed AV-PDFs used in PDFCHEM. We used three different medians (m = 5 blue line, m = 10 green line, and m = 15 orange line) and three different widths (σPDF = 0.2 solid lines, σPDF = 0.4 dashed lines, and σPDF = 0.6 dotted lines) that corresponded to different values of the mean ![]() . Table 2 summarizes the properties of these distributions.
. Table 2 summarizes the properties of these distributions.
Current usage metrics show cumulative count of Article Views (full-text article views including HTML views, PDF and ePub downloads, according to the available data) and Abstracts Views on Vision4Press platform.
Data correspond to usage on the plateform after 2015. The current usage metrics is available 48-96 hours after online publication and is updated daily on week days.
Initial download of the metrics may take a while.