Fig. 10
Download original image
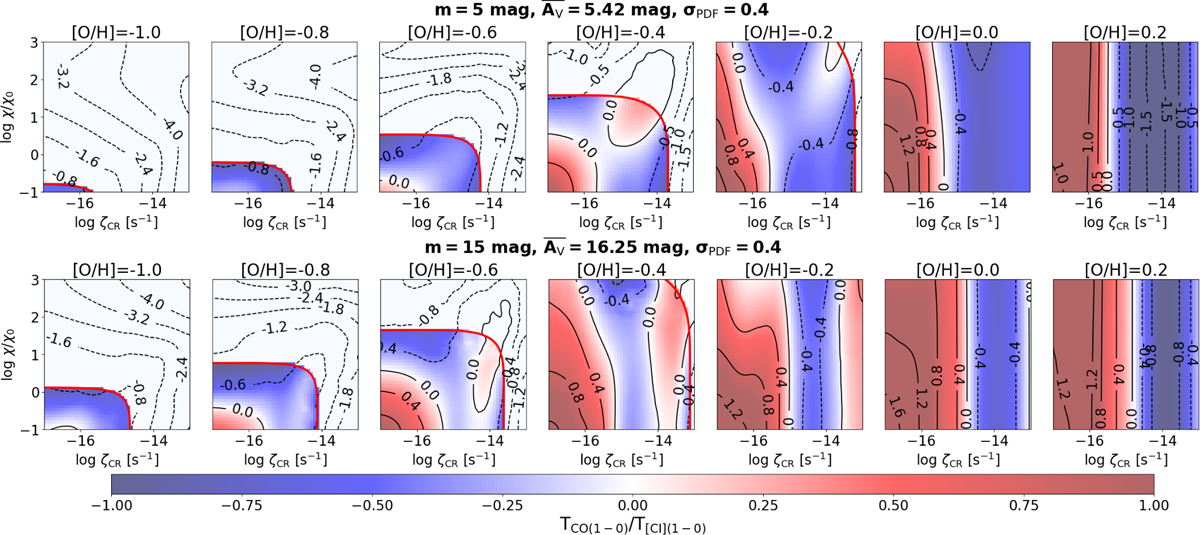
Logarithmic grid maps showing the ratio of CO (1−0) and [CI] (1−0) brightness temperatures. The color bar corresponds to the logarithm of this ratio. Positive values (red) indicate a stronger CO (1–0) brightness temperature, and negative values (blue) show a stronger [CI] (1−0) brightness temperature. The upper row corresponds to the m = 5 and σPDF = 0.4, and the bottom row shows the m = 15 and σPDF distribution.
Current usage metrics show cumulative count of Article Views (full-text article views including HTML views, PDF and ePub downloads, according to the available data) and Abstracts Views on Vision4Press platform.
Data correspond to usage on the plateform after 2015. The current usage metrics is available 48-96 hours after online publication and is updated daily on week days.
Initial download of the metrics may take a while.