Fig. 1
Download original image
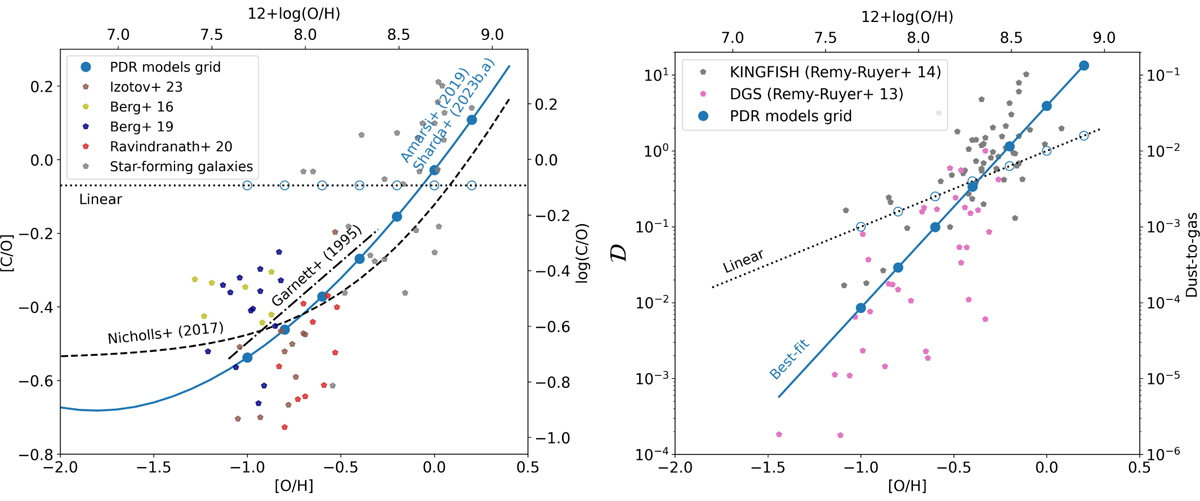
Left panel: [C/O]–[O/H] correlation based on Garnett et al. (1995) (dot-dashed black), Nicholls et al. (2017) (dashed black), and Amarsi et al. (2019) observations, the latter using the best-fit relations of Sharda et al. (2023b,a) (solid blue). The dotted black line shows the case when C/H scales linearly with O/H. The filled blue circles show the [C/O]−[O/H] pairs for which we performed the PDR modeling. The corresponding values for a linear relation between C/H and O/H are shown as empty blue circles. The observational data of Berg et al. (2016, 2019); Ravindranath et al. (2020); Izotov et al. (2023) are shown for comparison, including star-forming galaxies with abundances measured via recombination lines (Esteban et al. 2002, 2009, 2014; Pilyugin & Thuan 2005; García-Rojas & Esteban 2007; López-Sánchez et al. 2007). The secondary y-axis shows the log10(C/O) abundance ratio. Right panel: ![]() –[O/H] relation for the dust-to-gas ratio normalized to 10−2. The diamonds show observations from the DGS (Rémy-Ruyer et al. 2013) and KINGFISH (Rémy-Ruyer et al. 2014) surveys. The solid blue line shows the best-fit relation from these observations. The dotted black line shows the linear relation between the dust-to-gas ratio and O/H. As in the left panel, the empty and filled blue circles show the input values to the PDR models. The secondary y-axis shows the non-normalized dust-to-gas mass ratio.
–[O/H] relation for the dust-to-gas ratio normalized to 10−2. The diamonds show observations from the DGS (Rémy-Ruyer et al. 2013) and KINGFISH (Rémy-Ruyer et al. 2014) surveys. The solid blue line shows the best-fit relation from these observations. The dotted black line shows the linear relation between the dust-to-gas ratio and O/H. As in the left panel, the empty and filled blue circles show the input values to the PDR models. The secondary y-axis shows the non-normalized dust-to-gas mass ratio.
Current usage metrics show cumulative count of Article Views (full-text article views including HTML views, PDF and ePub downloads, according to the available data) and Abstracts Views on Vision4Press platform.
Data correspond to usage on the plateform after 2015. The current usage metrics is available 48-96 hours after online publication and is updated daily on week days.
Initial download of the metrics may take a while.