Fig. 8
Download original image
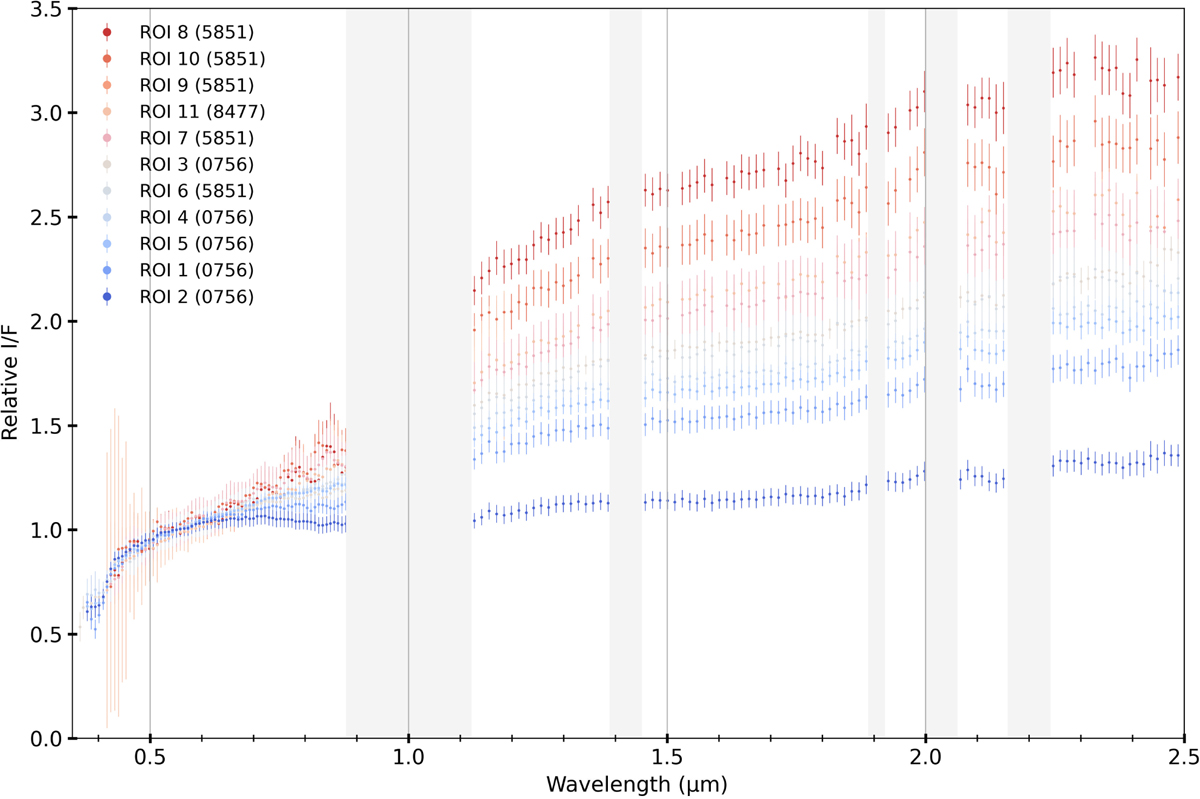
Spectra extracted from all three analysed datacubes. All of these spectra have been normalised to 0.55 μm. One can clearly observe a gradual transition from the bluest spectrum (ROI2) to the reddest one (ROI8). The ID of the ROIs is the same as used for Figs. 4D–F and for Figs. 5 and 6. As in Figs. 5 and 6, the error bars presented include both the associated standard deviations and the OMEGA instrumental uncertainties.
Current usage metrics show cumulative count of Article Views (full-text article views including HTML views, PDF and ePub downloads, according to the available data) and Abstracts Views on Vision4Press platform.
Data correspond to usage on the plateform after 2015. The current usage metrics is available 48-96 hours after online publication and is updated daily on week days.
Initial download of the metrics may take a while.