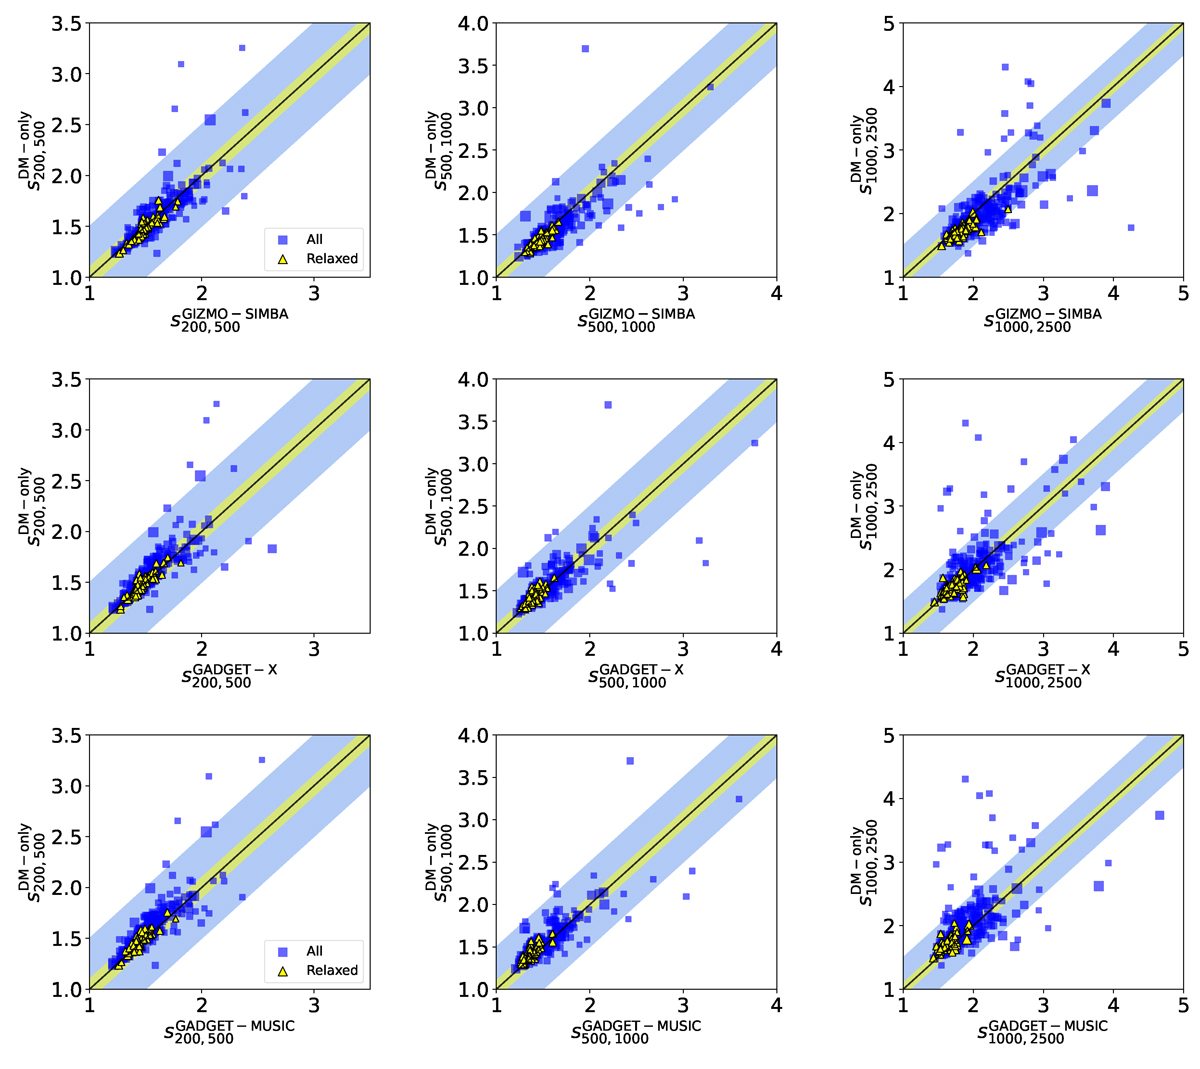
Fig. 2.
Download original image
DM-only versus hydro-simulation-estimated sparsities s200, 500 (left panels), s500, 1000 (central panels) and s1000, 2500 (right panels) for the clusters in the GIZMO-SIMBA (top panels), GADGET-X (central panels), and GADGET-MUSIC (bottom panels) catalogues at z = 0, respectively. The blue squares represent clusters from the full samples, while the yellow triangles corresponds to the relaxed systems as defined in Sec. 2.2. The size of the data points is proportional to mass M200 of each cluster from the DM-only simulation. The diagonal line represents the ideal case with no bias, while the shaded areas correspond to 10% (yellow band) and 50% (light-blue band) deviation respectively.
Current usage metrics show cumulative count of Article Views (full-text article views including HTML views, PDF and ePub downloads, according to the available data) and Abstracts Views on Vision4Press platform.
Data correspond to usage on the plateform after 2015. The current usage metrics is available 48-96 hours after online publication and is updated daily on week days.
Initial download of the metrics may take a while.