Fig. 14.
Download original image
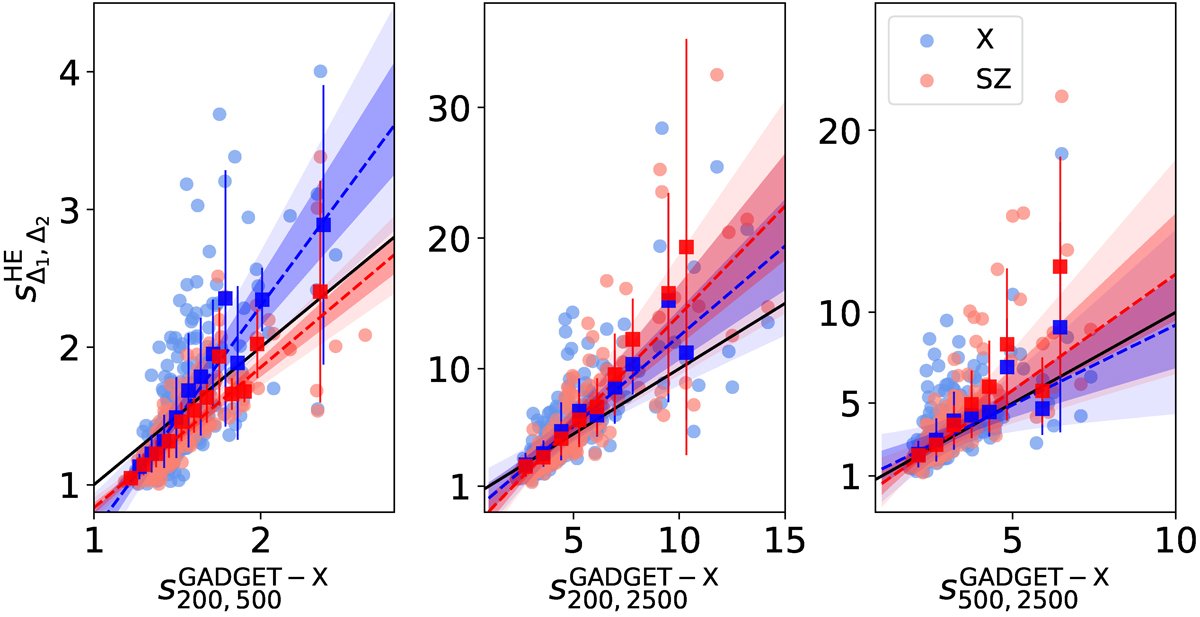
HE sparsities sΔ1, Δ2HE from the X (blue) and SZ (red) catalogues with respect to their GADGET-X counterparts at z = 0 in the case of s200, 500 (left panel), s500, 2500(central panel), and s200, 2500 (right panel). The coloured dashed line correspond to the average linear fit to the 25 equally spaced binned data points (squares) in bins of true sparsities containing at least two clusters. The shaded areas indicates that 1 and 2σ credible regions. The black solid line corresponds to the unbiased case.
Current usage metrics show cumulative count of Article Views (full-text article views including HTML views, PDF and ePub downloads, according to the available data) and Abstracts Views on Vision4Press platform.
Data correspond to usage on the plateform after 2015. The current usage metrics is available 48-96 hours after online publication and is updated daily on week days.
Initial download of the metrics may take a while.