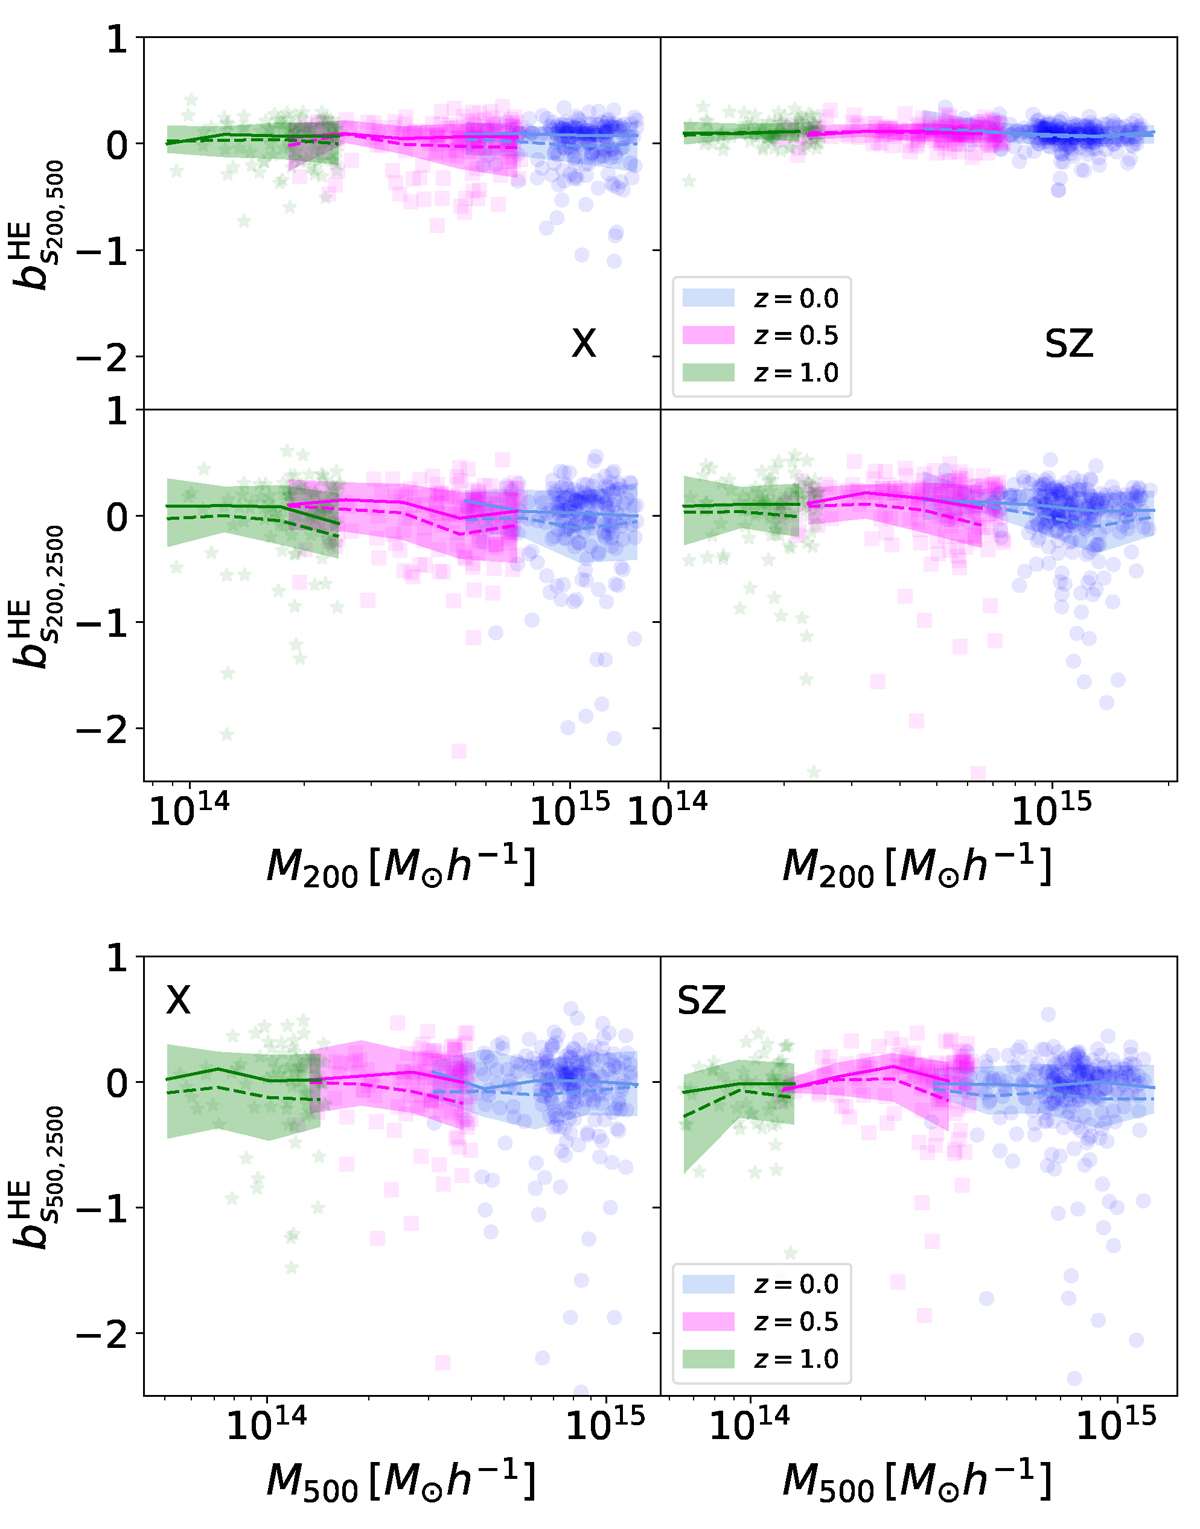
Fig. 12.
Download original image
HE sparsity bias bs200, 500 and bs200, 2500 as function of M200 (top panels) and bs500, 2500 as function of M500 (bottom panel) for the X (left panels) and SZ (right panels) masses of the full cluster sample at z = 0.0 (blue circles), 0.5 (magenta squares), and 1.0 (green stars). The different lines correspond to the median (solid) and the mean (dashed), while the shaded area to the region comprised between the 16th and 84th percentile.
Current usage metrics show cumulative count of Article Views (full-text article views including HTML views, PDF and ePub downloads, according to the available data) and Abstracts Views on Vision4Press platform.
Data correspond to usage on the plateform after 2015. The current usage metrics is available 48-96 hours after online publication and is updated daily on week days.
Initial download of the metrics may take a while.