Fig. 1.
Download original image
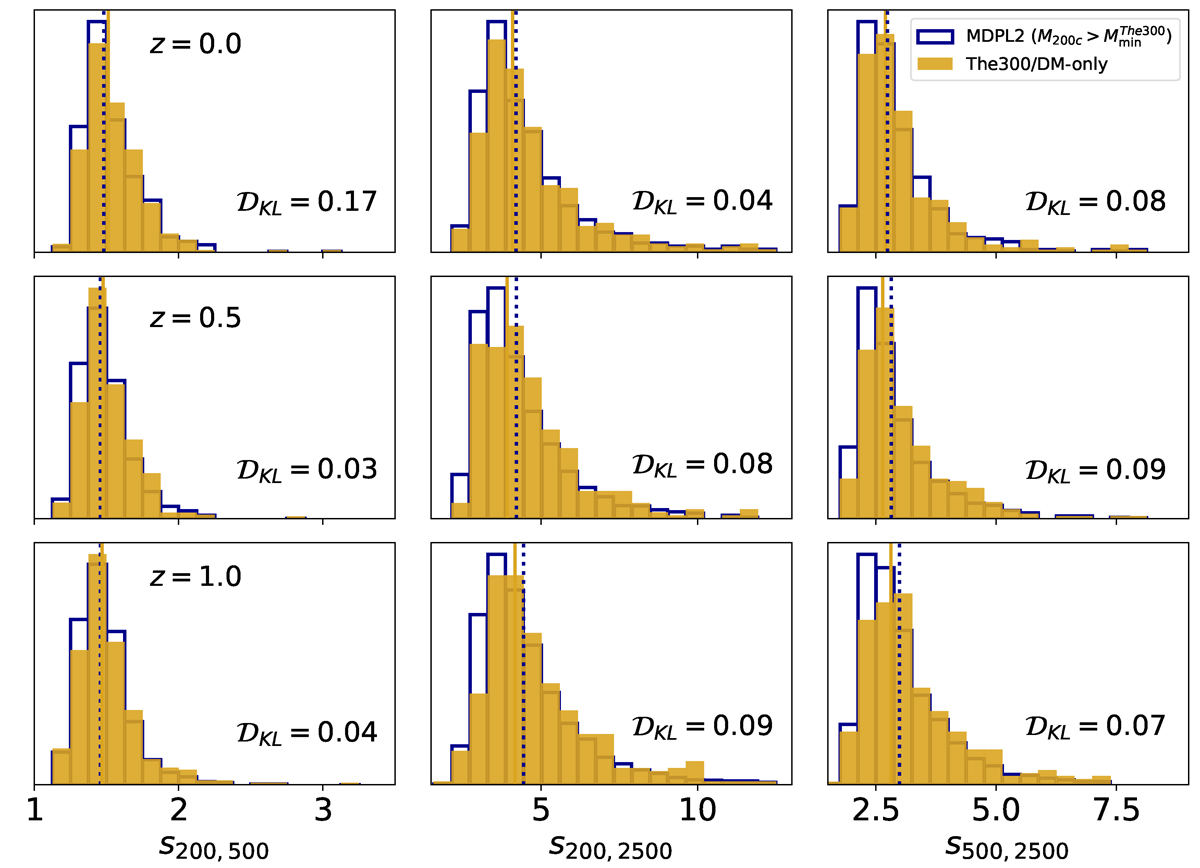
Normalised histograms of the sparsity s200, 500 (left panels), s200, 2500 (central panels), and s500, 2500 (right panels) obtained from the analysis of the MDPL2 sub-sample (dark blue bars) and The300/DM-only catalogue (goldenrod filled bars) at z = 0.0 (top panels), 0.5 (middle panels), and 1.0 (bottom panels), where the MDPL2 sub-sample consists of haloes with a mass larger than the minimum mass of the DM-only catalogue at the redshift considered. The vertical lines in each panel correspond to the median sparsities for the MDPL2 sub-sample (dark blue dotted line) and the The300/DM-only sample (goldenrod solid line).
Current usage metrics show cumulative count of Article Views (full-text article views including HTML views, PDF and ePub downloads, according to the available data) and Abstracts Views on Vision4Press platform.
Data correspond to usage on the plateform after 2015. The current usage metrics is available 48-96 hours after online publication and is updated daily on week days.
Initial download of the metrics may take a while.