Fig. 9
Download original image
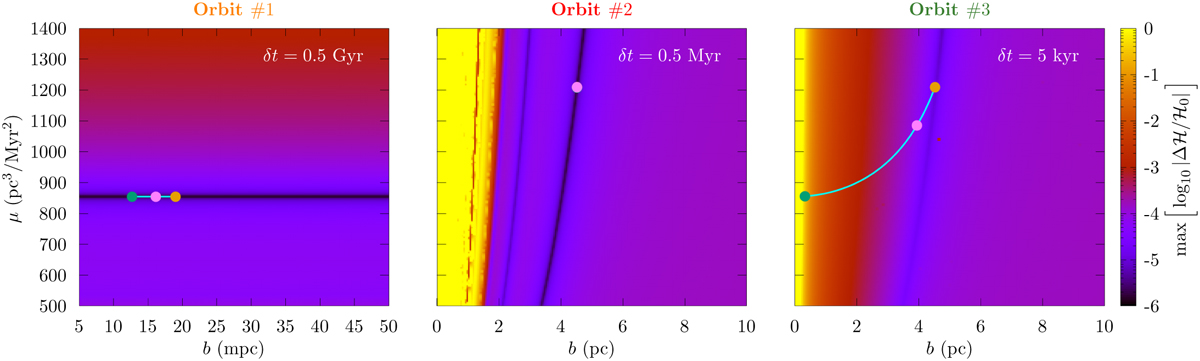
Maximum relative variation in the Hamiltonian as a function of the parameters μ and b of the isochrone potential used for the splitting. Each column corresponds to a different orbit (orange, red, and green points in Figs. 5 and 6), integrated with 𝒮𝒜ℬ𝒜1 over two radial periods for a given integration time step, δt. The orange, green, and pink points correspond to the isochrone splitting with parametrisation points q = rp, q = ra, and q = r⋆, respectively (the points overlap for Orbit #2), while the cyan curve shows all possible parametrisation points, q, between the periapsis distance and apoapsis distance, following Eq. (34).
Current usage metrics show cumulative count of Article Views (full-text article views including HTML views, PDF and ePub downloads, according to the available data) and Abstracts Views on Vision4Press platform.
Data correspond to usage on the plateform after 2015. The current usage metrics is available 48-96 hours after online publication and is updated daily on week days.
Initial download of the metrics may take a while.