Fig. 7
Download original image
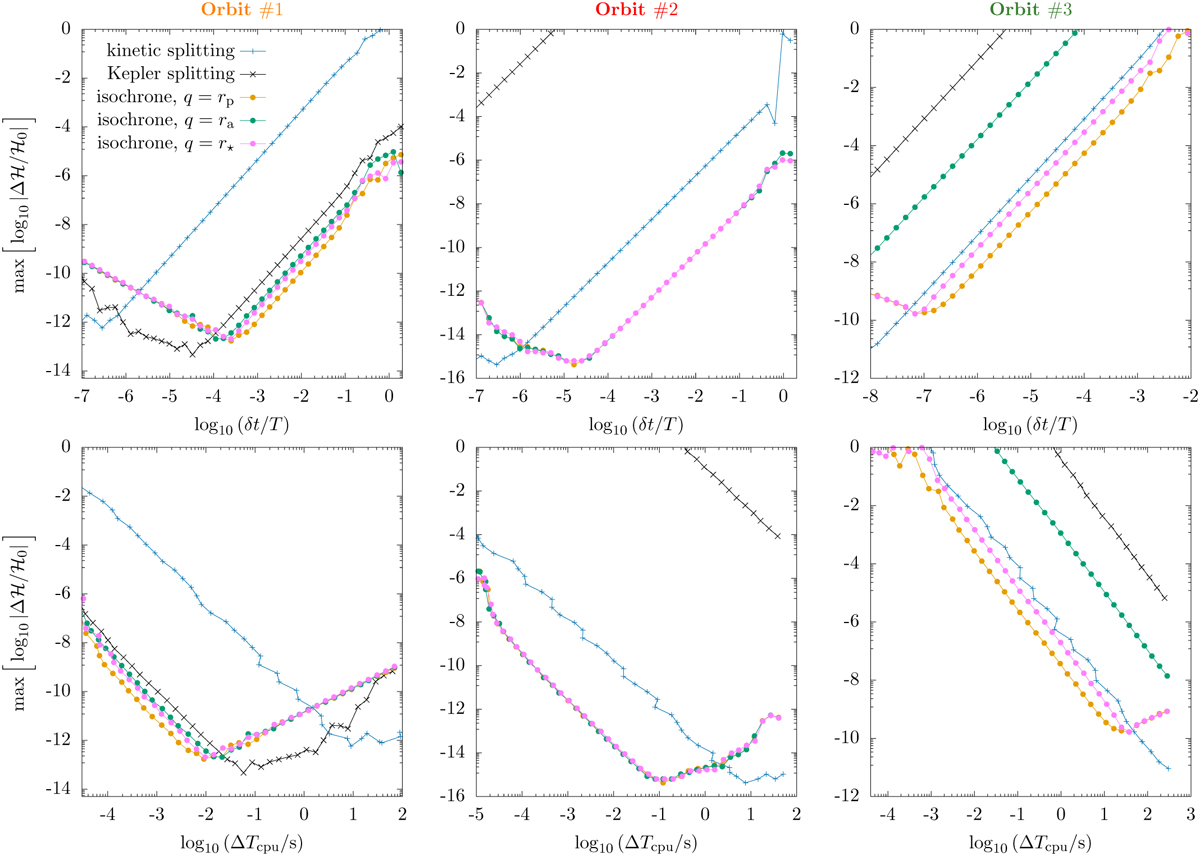
Maximum relative variation in the Hamiltonian as a function of the integration time step over the radial period (top row) and as a function of the CPU integration time (bottom row). Each column corresponds to a different orbit (orange, red, and green points in Figs. 5 and 6), integrated over two radial periods with 𝒮𝒜ℬ𝒜1. The blue curve and the black curve show the results obtained when using kinetic splitting and Kepler splitting. The orange, green, and pink curves correspond to the isochrone splitting with parametrisation points q = rp, q = ra, and q = r⋆, respectively.
Current usage metrics show cumulative count of Article Views (full-text article views including HTML views, PDF and ePub downloads, according to the available data) and Abstracts Views on Vision4Press platform.
Data correspond to usage on the plateform after 2015. The current usage metrics is available 48-96 hours after online publication and is updated daily on week days.
Initial download of the metrics may take a while.