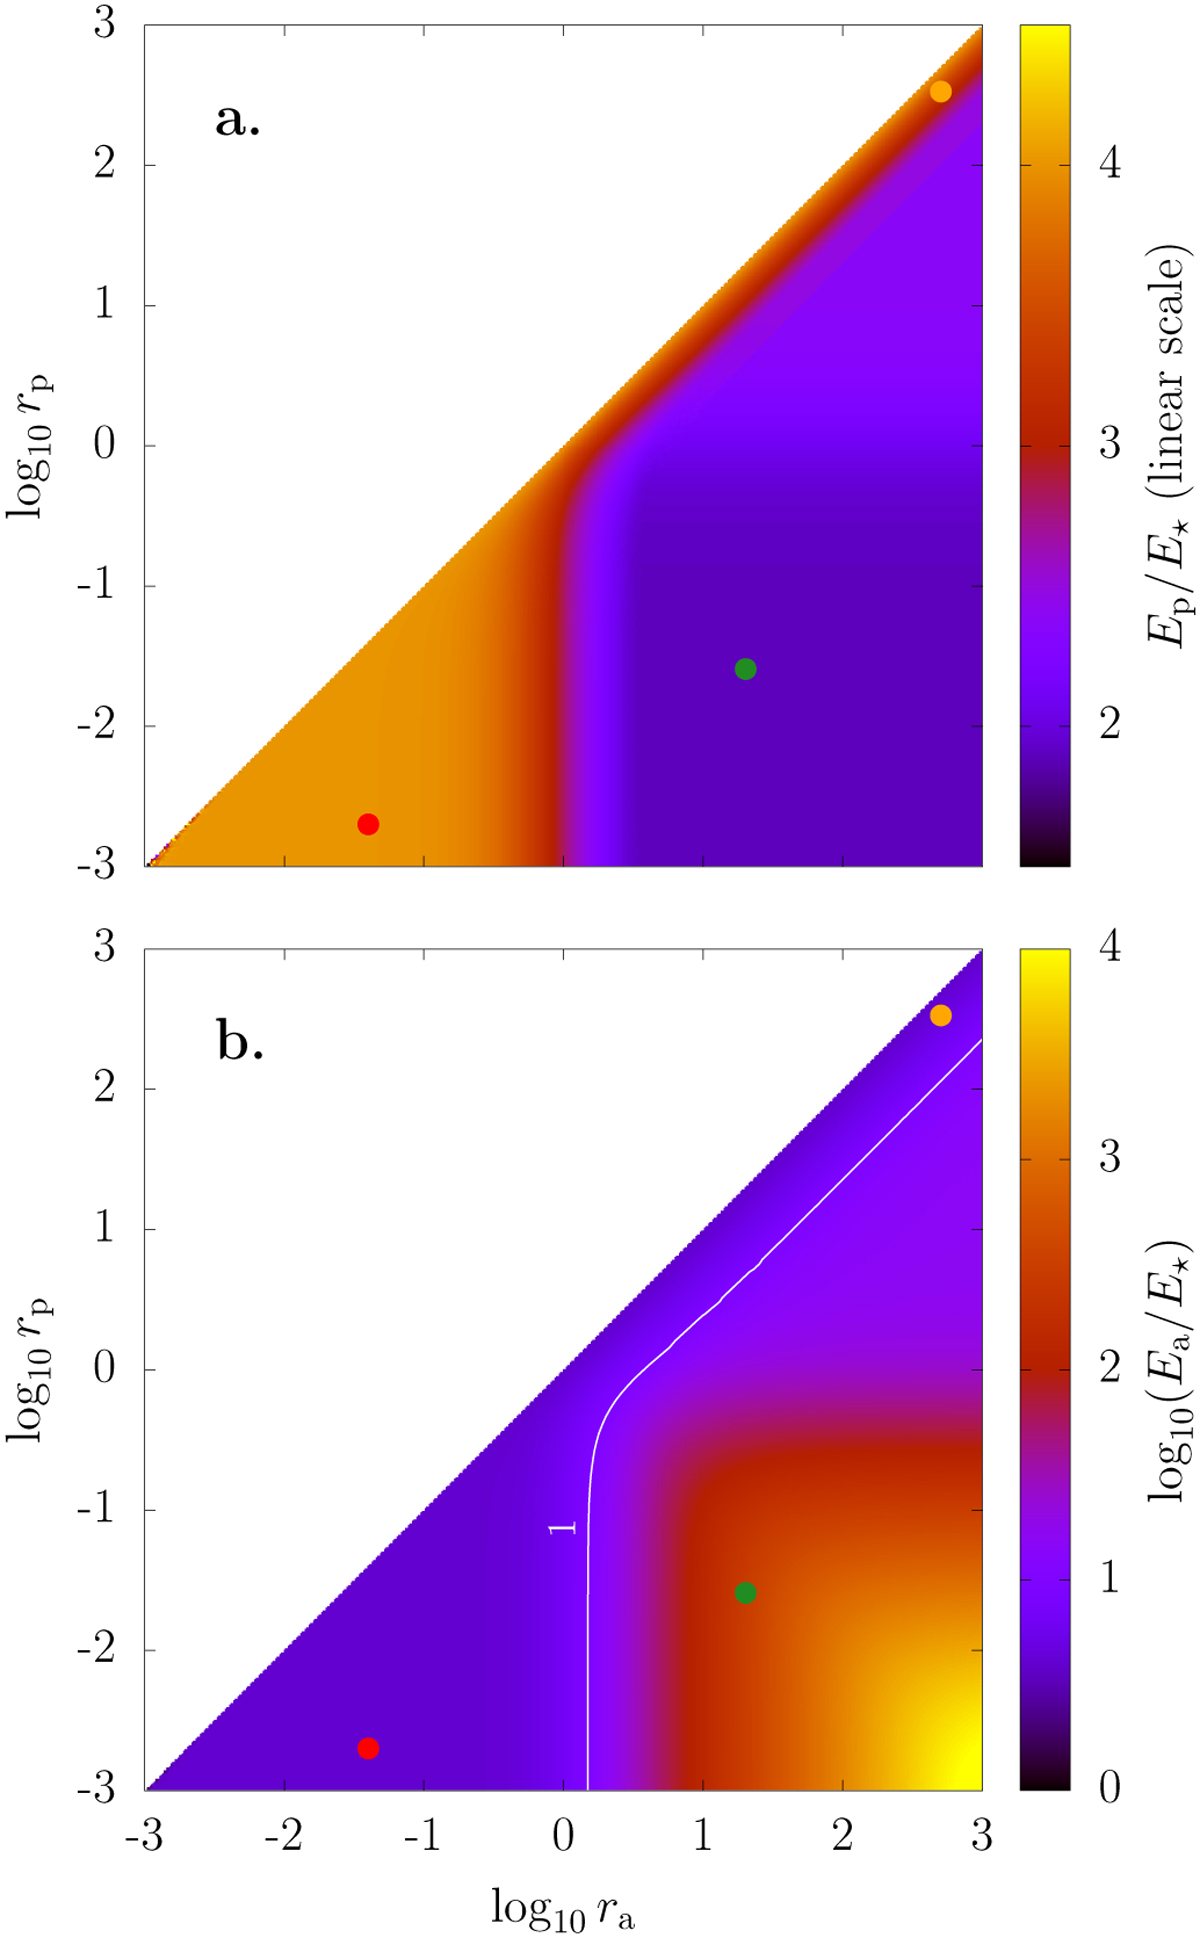
Fig. 6
Download original image
Size, E, of the perturbation computed for q = rp (panel a) and q = ra (panel b) compared to the best parametrisation point, q⋆. The colour scale in panel a is linear; the colour scale in panel b is logarithmic. The level curve Ea/E⋆ = 10 is shown in white. The three coloured points were used for the numerical experiments described in Sect. 6 (see Figs. 7 and 8).
Current usage metrics show cumulative count of Article Views (full-text article views including HTML views, PDF and ePub downloads, according to the available data) and Abstracts Views on Vision4Press platform.
Data correspond to usage on the plateform after 2015. The current usage metrics is available 48-96 hours after online publication and is updated daily on week days.
Initial download of the metrics may take a while.