Fig. A.1
Download original image
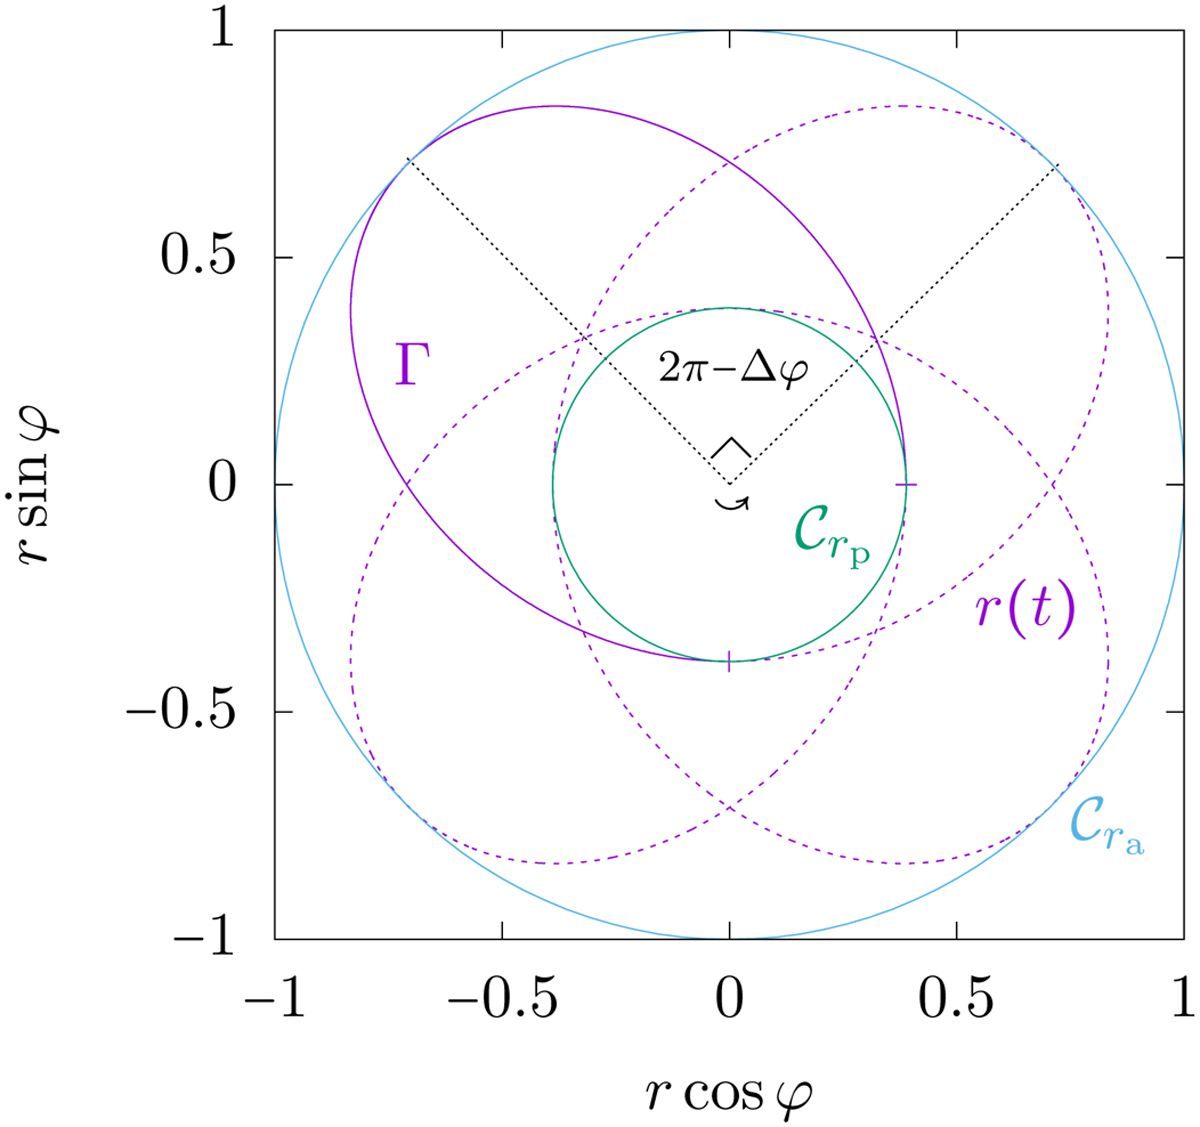
Example of a particle’s motion in its orbital plane (a special case of a closed orbit where Δφ = 3π/2) with the isochrone parameters μ = 1 and b = 2 × 10⁻¹. The green and blue circles, labelled Crp and Cra, respectively show the particle’s minimum and maximum radial positions. The dashed violet line, denoted by r(t), shows the particle’s orbit. The solid violet line shows the path of the particle during one radial period; its length is given by Γ (see Eq. (A.4)). The small arrow indicates the rotational sense of the loops.
Current usage metrics show cumulative count of Article Views (full-text article views including HTML views, PDF and ePub downloads, according to the available data) and Abstracts Views on Vision4Press platform.
Data correspond to usage on the plateform after 2015. The current usage metrics is available 48-96 hours after online publication and is updated daily on week days.
Initial download of the metrics may take a while.