Fig. 9.
Download original image
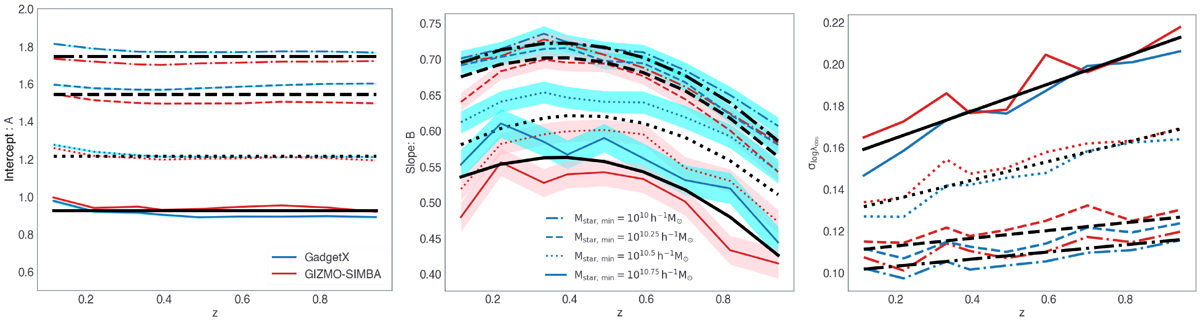
Intercept A, slope B, and scatter σlog λobs at a fixed weak-lensing cluster mass as a function of redshift. Blue and red curves refer to the two hydro simulations: GadgetX and GIZMO-SIMBA, respectively. In all panels, the results referring to a given stellar mass cuts are reported with different line styles. The black curves show the best-fit models as a function of redshift, combining both hydro run results at a fixed stellar mass cut. The best-fit values are reported in Table 1.
Current usage metrics show cumulative count of Article Views (full-text article views including HTML views, PDF and ePub downloads, according to the available data) and Abstracts Views on Vision4Press platform.
Data correspond to usage on the plateform after 2015. The current usage metrics is available 48-96 hours after online publication and is updated daily on week days.
Initial download of the metrics may take a while.