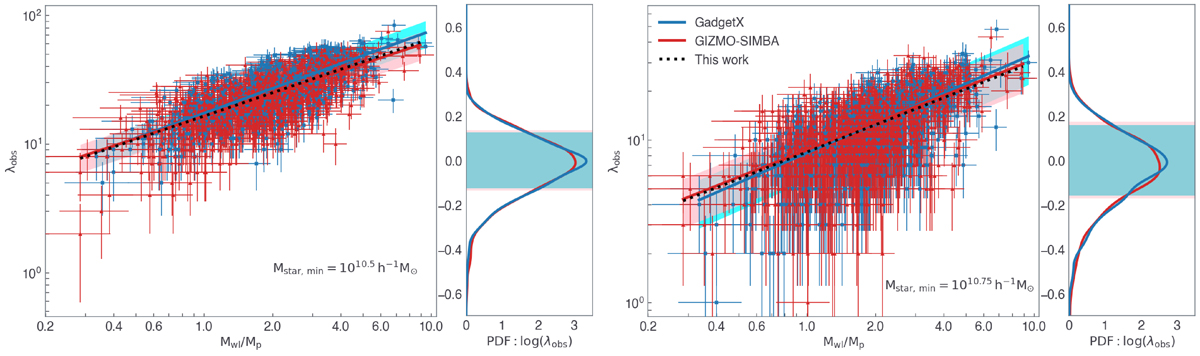
Fig. 8.
Download original image
Weak-lensing mass-observed richness relation measured for the clusters at redshift z = 0.22 run with both hydrocodes GadgetX in blue and GIZMO-SIMBA in red, respectively. The blue points are thus the same from Figure 7. The solid lines show the linear regression model results, with the shaded region indicating the 1σ uncertainty on the intercept and slope parameters. In each sub-figure – where we consider two different stellar mass cuts when computing λobs, the right sub-panel shows the PDF of the scatter of the observed richness (using a Gaussian KDE) with respect to the best-fit linear regression model; the shaded bands mark the corresponding 1σ deviation: σlog λ.
Current usage metrics show cumulative count of Article Views (full-text article views including HTML views, PDF and ePub downloads, according to the available data) and Abstracts Views on Vision4Press platform.
Data correspond to usage on the plateform after 2015. The current usage metrics is available 48-96 hours after online publication and is updated daily on week days.
Initial download of the metrics may take a while.