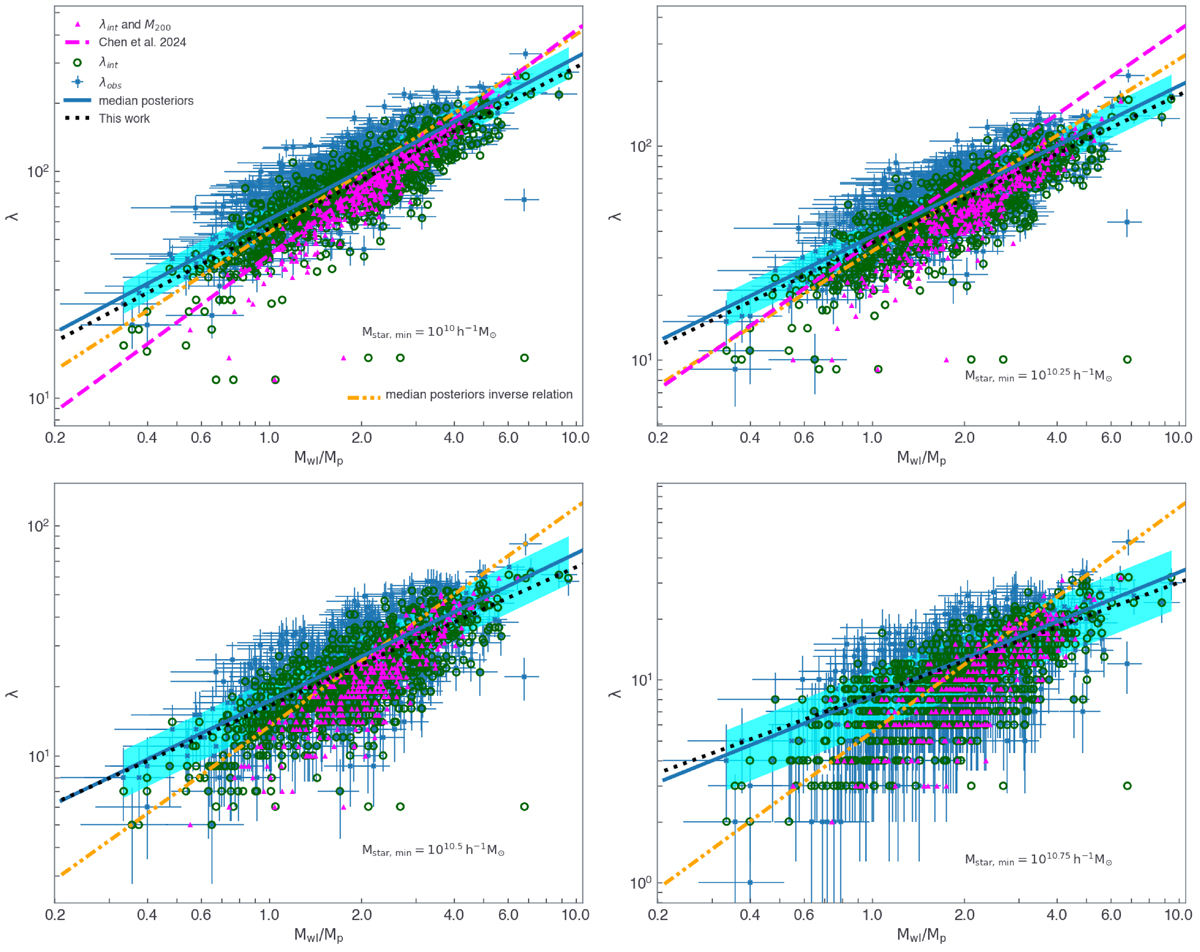
Fig. 7.
Download original image
Weak-lensing mass-observed richness relation measured for the clusters at redshift z = 0.22 run with GadgetX. The different panels consider different minimum stellar mass cuts Mstar, min, from 1010 to 1010.75 h−1 M⊙. The weak-lensing masses Mwl are rescaled with respect to the pivot value Mp = 3 × 10¹⁴ h−1 M⊙. The blue points with the corresponding error bars show the results for the observed richness calculated as in Eq. (14) and the derived weak-lensing mass from the tangential shear profile. For the magenta triangles, the mass is not Mwl, but M200; correspondingly we show the number λint of galaxies within R200. The green circles show the results when using Mwl and the number of subhaloes in a sphere with radius R200. The solid blue line displays the results of our fit performed using MCMC on the blue data points, and in cyan, the 1σ uncertainty. The orange dash-dotted line is the best fit of the inverse relation; see Eq. (18). Black dotted lines display the model presented in this work, WLOR relation as in Eq. (15) considering the values reported in Table 1.
Current usage metrics show cumulative count of Article Views (full-text article views including HTML views, PDF and ePub downloads, according to the available data) and Abstracts Views on Vision4Press platform.
Data correspond to usage on the plateform after 2015. The current usage metrics is available 48-96 hours after online publication and is updated daily on week days.
Initial download of the metrics may take a while.