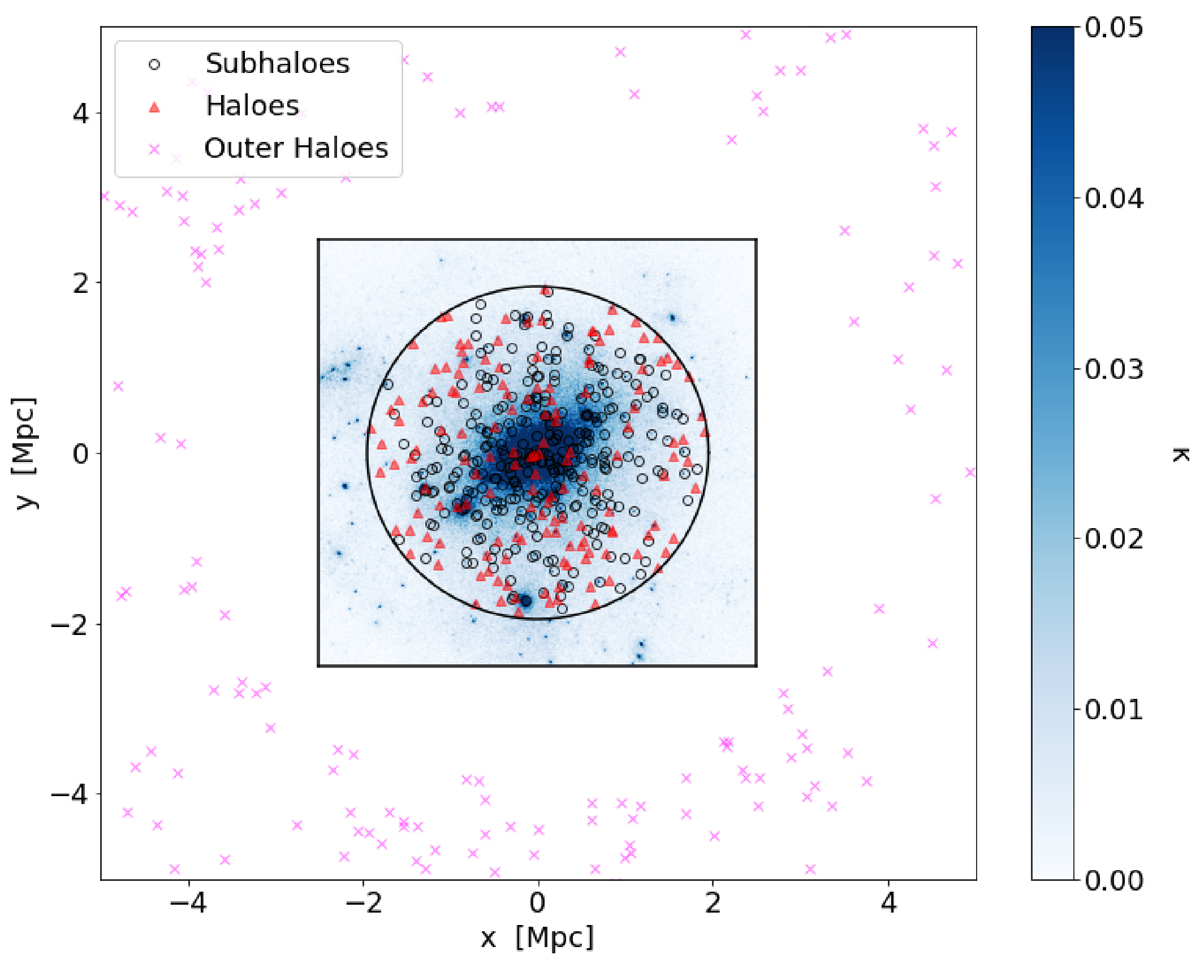
Fig. 6.
Download original image
Halo and subhalo distribution in the projection x-y considering a field of view of 10 Mpc on a side and ±5 Mpc along the line of sight, ΔH = 10 Mpc, for the GadgetX cluster run. Black circles show the location of the centre of all subhaloes within the halo radius R200, red triangles are all haloes which, in projection, fall within the halo radius, and magenta crosses are all haloes that, in projection, lie in a ring between 2 and 3.5 R200, which we term outer haloes. The blue map is the corresponding region where we simulate the weak-lensing cluster signal.
Current usage metrics show cumulative count of Article Views (full-text article views including HTML views, PDF and ePub downloads, according to the available data) and Abstracts Views on Vision4Press platform.
Data correspond to usage on the plateform after 2015. The current usage metrics is available 48-96 hours after online publication and is updated daily on week days.
Initial download of the metrics may take a while.