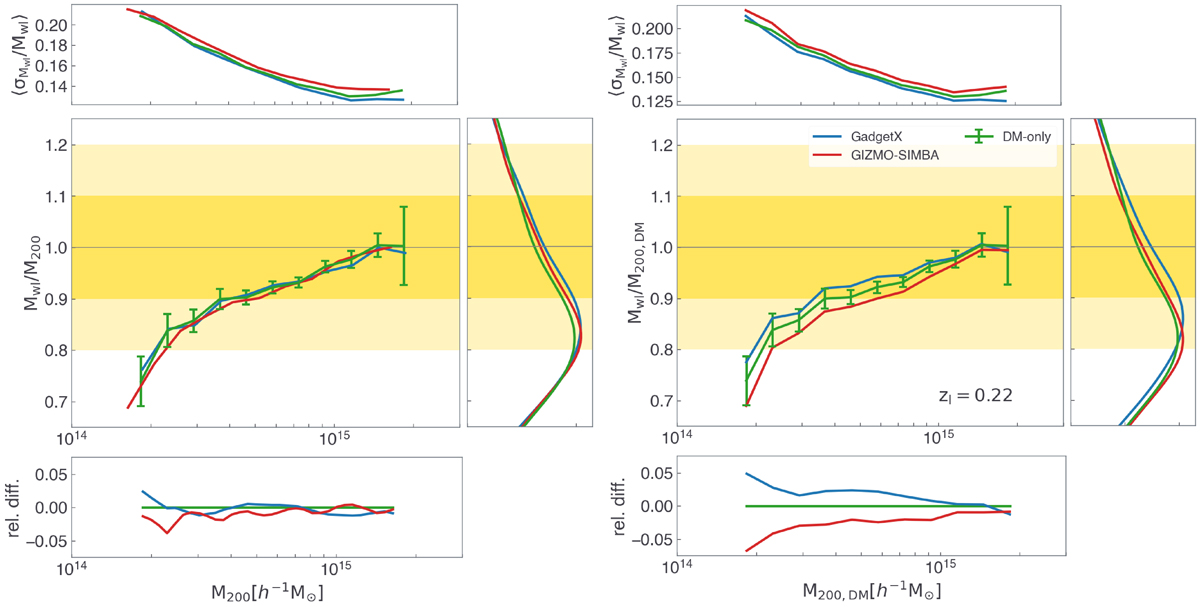
Fig. 4.
Download original image
Average weak-lensing mass biases as a function of the corresponding three-dimensional masses. On the left, the weak lensing masses are relative to their respective total mass; on the right, they are always related to the total mass of the DM-only runs. The top and bottom sub-panels show the mean relative uncertainties and the relative differences with to the DM-only case as a function of considered three-dimensional reference mass, respectively. The right panels display the distribution of the weak-lensing mass biases over all cluster masses. The dark and light yellow bands show the 10% and 20% differences, respectively.
Current usage metrics show cumulative count of Article Views (full-text article views including HTML views, PDF and ePub downloads, according to the available data) and Abstracts Views on Vision4Press platform.
Data correspond to usage on the plateform after 2015. The current usage metrics is available 48-96 hours after online publication and is updated daily on week days.
Initial download of the metrics may take a while.