Fig. 2.
Download original image
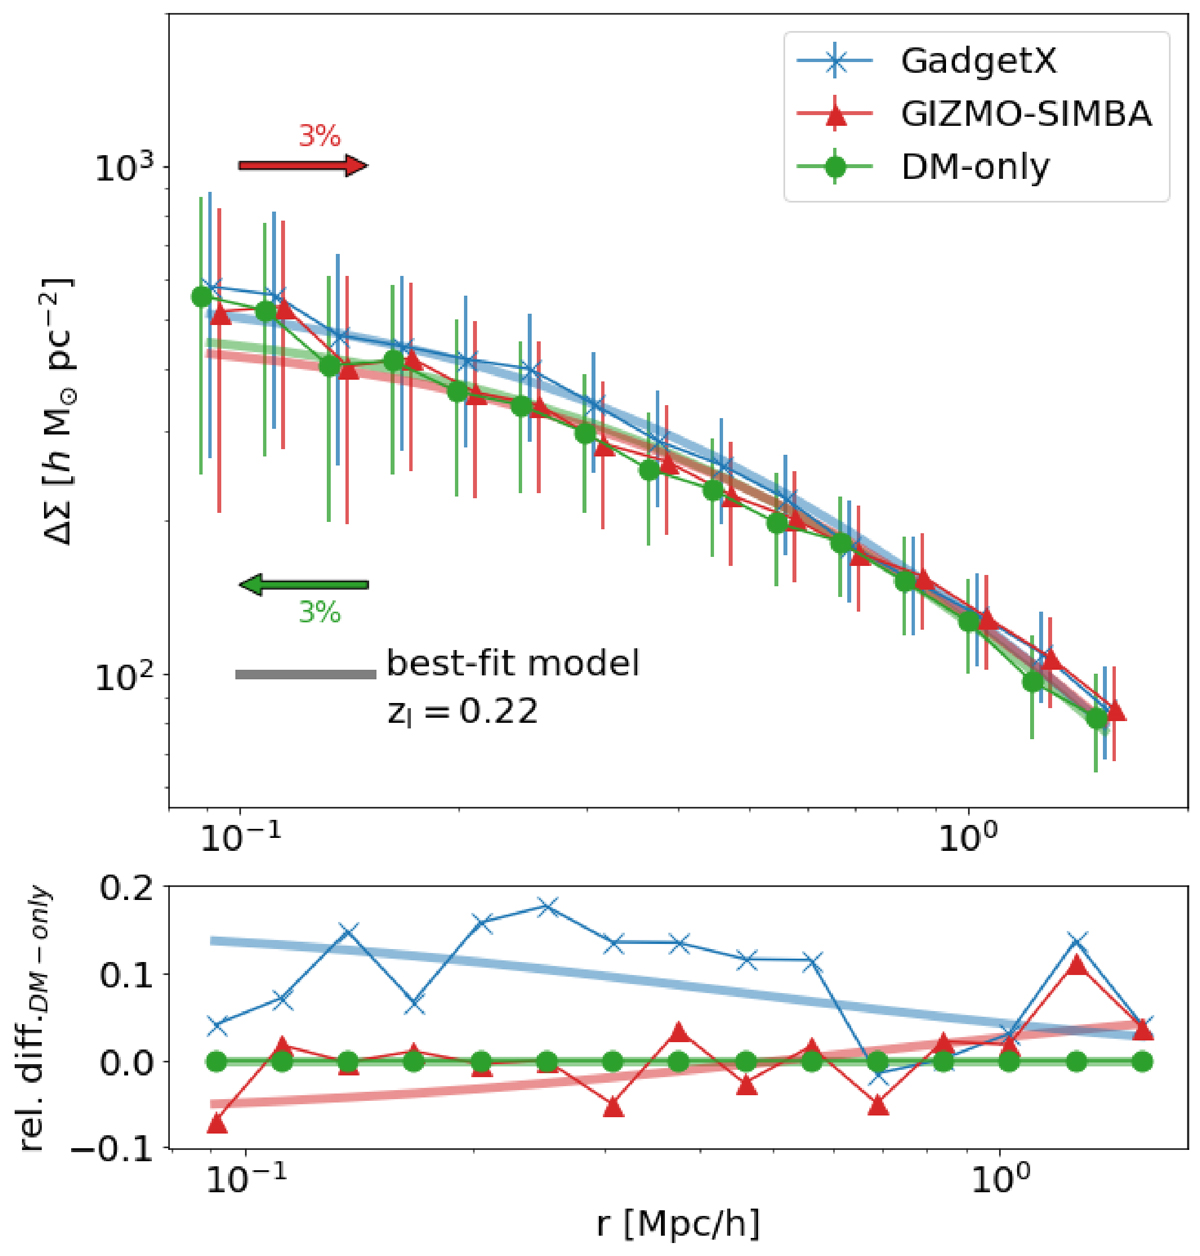
Excess surface mass density profile of the projections displayed in Fig. 1. The colours used for the data points, blue, red and green, correspond to the GadgetX, GIZMO-SIMBA and DM-only run, respectively. The bottom panel displays the relative difference with respect to the DM-only case. The best-fit models are shown using solid curves, coloured according to each considered case.
Current usage metrics show cumulative count of Article Views (full-text article views including HTML views, PDF and ePub downloads, according to the available data) and Abstracts Views on Vision4Press platform.
Data correspond to usage on the plateform after 2015. The current usage metrics is available 48-96 hours after online publication and is updated daily on week days.
Initial download of the metrics may take a while.