Fig. A.1.
Download original image
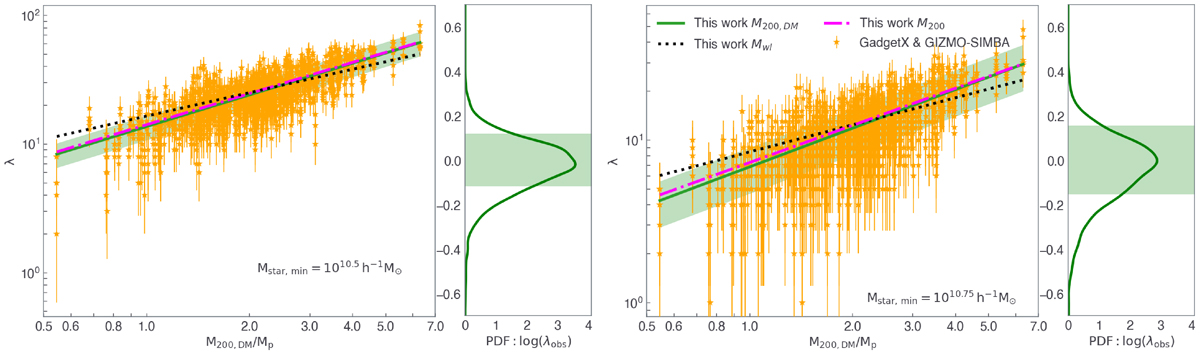
DM-only true mass-observed richness relation for the clusters at redshift z = 0.22. The richnesses have been measured using the two corresponding hydro runs – GadgetX and GIZMO-SIMBA – and considering the three projections per cluster. The solid green lines show the linear regression model results, with the coloured corresponding shaded region indicating the 1 σ uncertainty on the intercept and slope parameters. The dotted black and magenta long-dashed lines report to the model for the true hydro and weak lensing masses, as discussed in the main text. The corresponding right sub-panels display the PDF of the observed richnesses with respect to the best-fit linear model, with the shaded regions marking the corresponding σlog λobs.
Current usage metrics show cumulative count of Article Views (full-text article views including HTML views, PDF and ePub downloads, according to the available data) and Abstracts Views on Vision4Press platform.
Data correspond to usage on the plateform after 2015. The current usage metrics is available 48-96 hours after online publication and is updated daily on week days.
Initial download of the metrics may take a while.