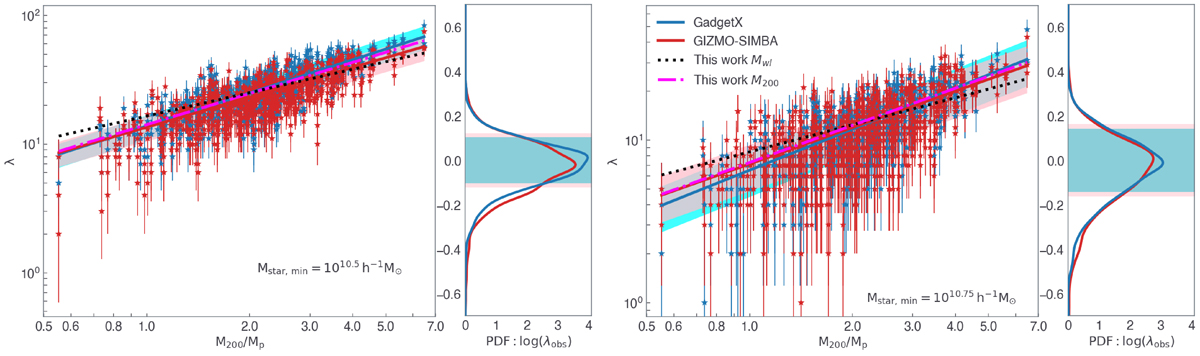
Fig. 11.
Download original image
True mass-observed richness relation for the clusters at redshift z = 0.22 as measured in both hydro-runs. The solid lines show the linear regression model results, with the shaded region indicating the 1σ uncertainty on the intercept and slope parameters. In each sub-figure, the right sub-panel shows the probability distribution function of the λobs with respect to the corresponding best-fit linear model, with the shaded regions marking the corresponding scatter σlog λobs. The dotted black lines exhibit the model for the richness weak-lensing mass relation, as described in the last section.
Current usage metrics show cumulative count of Article Views (full-text article views including HTML views, PDF and ePub downloads, according to the available data) and Abstracts Views on Vision4Press platform.
Data correspond to usage on the plateform after 2015. The current usage metrics is available 48-96 hours after online publication and is updated daily on week days.
Initial download of the metrics may take a while.