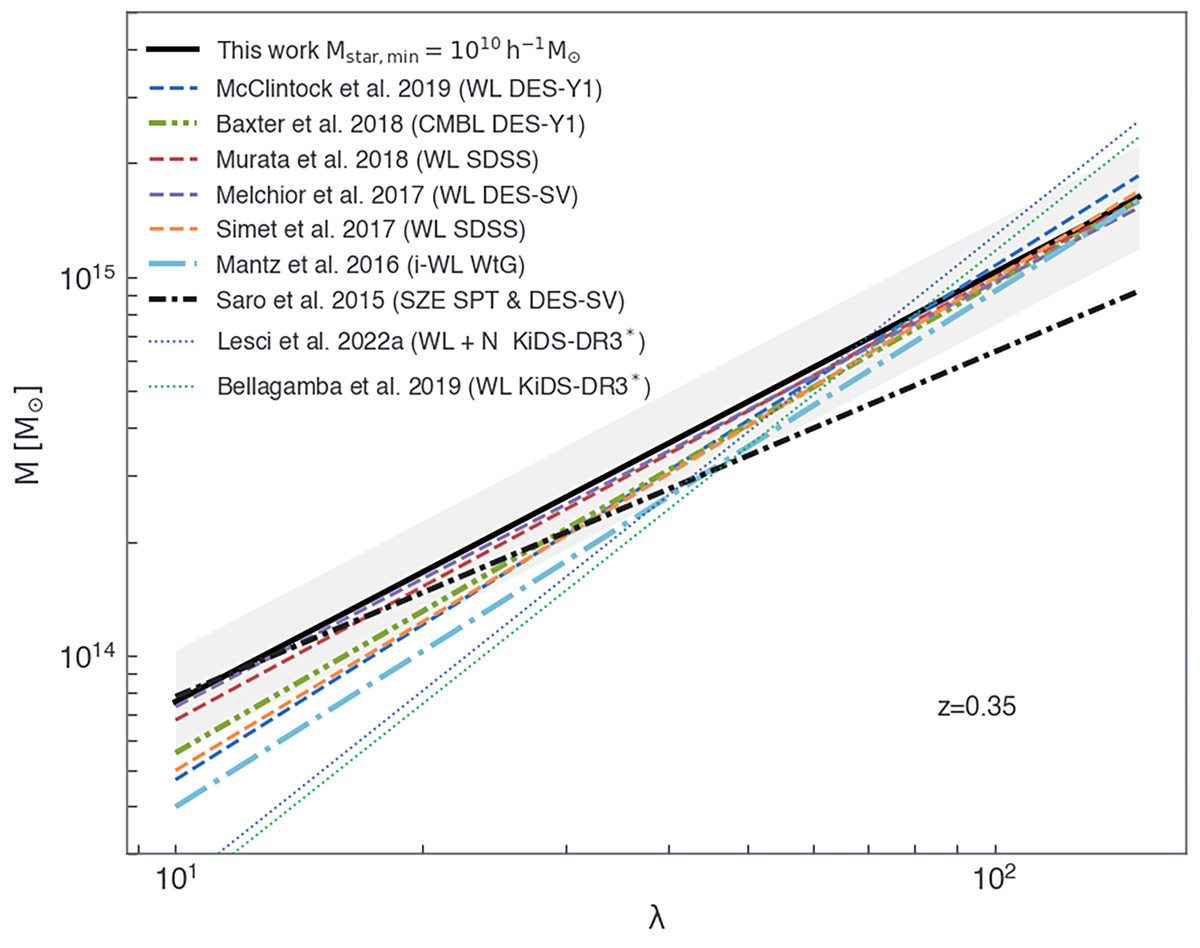
Fig. 10.
Download original image
Observed richness-weak-lensing mass relation comparison with different literature results. We compute our model considering an observed richness with a minimum stellar mass of Mstar, min = 1010 h−1 M⊙ and the parameters have been calculated at z = 0.35. All redMaPPer (Rykoff et al. 2014) richness definitions have been rescaled to DES-Y1 by McClintock et al. (2019) (see their Table 5). The two dotted lines referring to KiDS-DR3 clusters from Lesci et al. (2022a) and Bellagamba et al. (2019) have been computed with the AMICO cluster finder algorithm (Maturi et al. 2019).
Current usage metrics show cumulative count of Article Views (full-text article views including HTML views, PDF and ePub downloads, according to the available data) and Abstracts Views on Vision4Press platform.
Data correspond to usage on the plateform after 2015. The current usage metrics is available 48-96 hours after online publication and is updated daily on week days.
Initial download of the metrics may take a while.