Fig. 8.
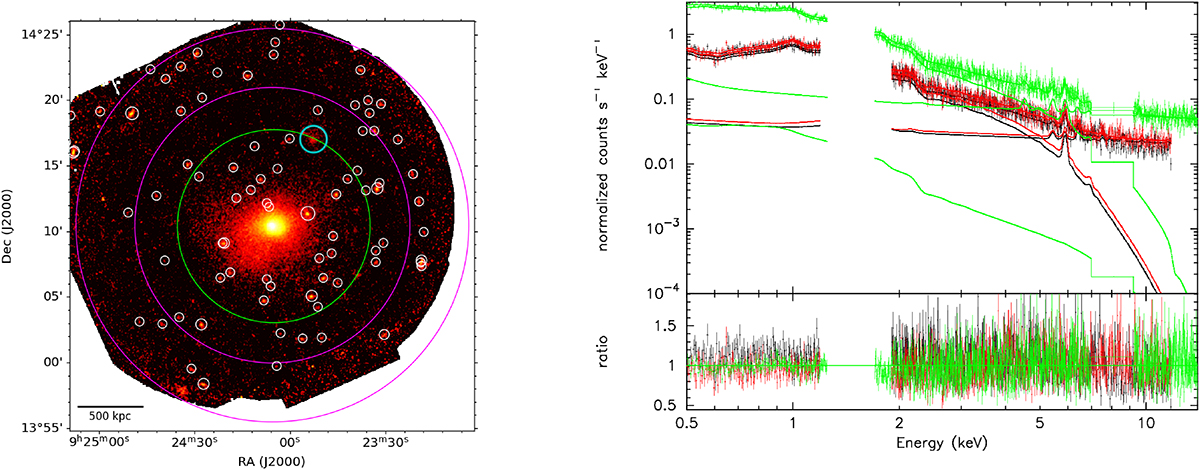
Download original image
Spectral analysis of A795. Left panel: XMM-EPIC (0.5–2 keV) surface brightness image Gaussian-smoothed with a kernel radius of 3 pixels. The green region was used for the global spectral analysis of the cluster A795, while the magenta one for the background. The white circles mark the position of the excluded sources and the cyan region signs the position of A795-B, see Sect. 4.3. Right panel: XMM-EPIC spectrum of A795 within the green region of the left panel, fitted with a thermal component and the background model. The red and black lines represent the models for MOS1 and MOS2 while the green one for pn. The lower panel shows the residuals from the best-fit curve. The best-fit parameters for the cluster thermal component are summarized in Table 6.
Current usage metrics show cumulative count of Article Views (full-text article views including HTML views, PDF and ePub downloads, according to the available data) and Abstracts Views on Vision4Press platform.
Data correspond to usage on the plateform after 2015. The current usage metrics is available 48-96 hours after online publication and is updated daily on week days.
Initial download of the metrics may take a while.