Open Access
Fig. 7.
Download original image
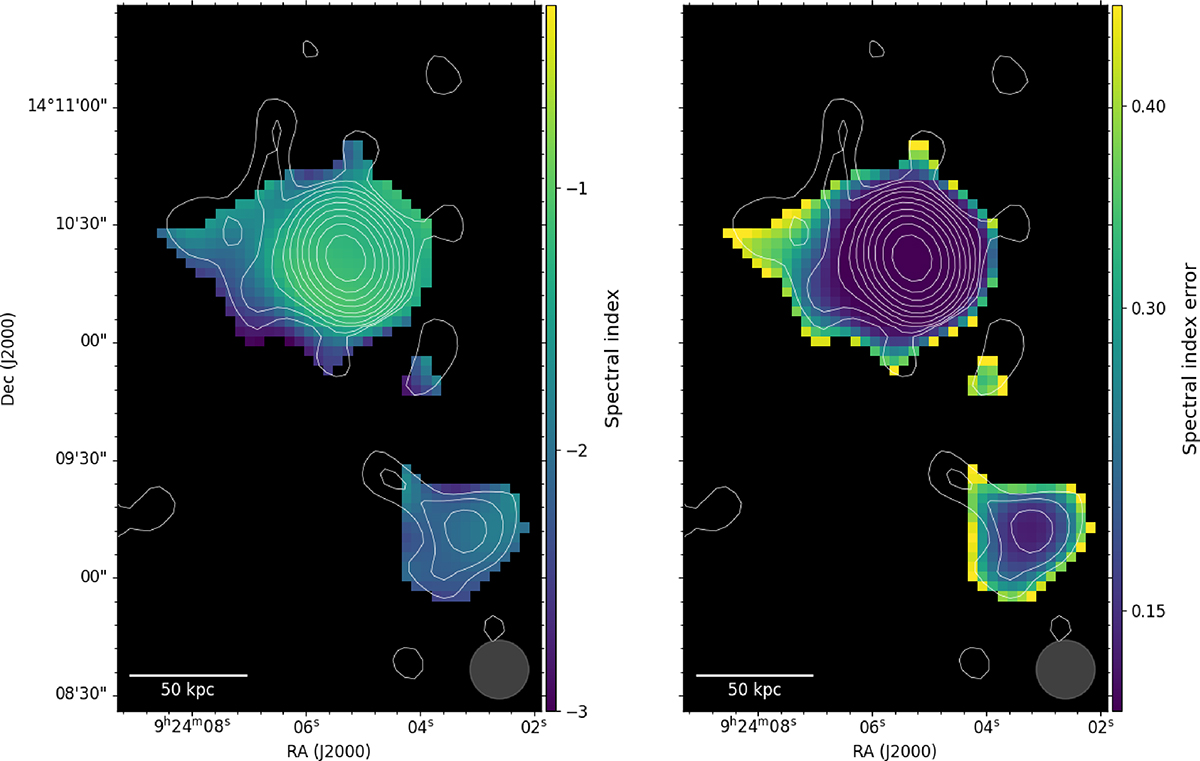
Spectral index map (left) and spectral index error map (right) measured at 325 MHz and 1.5 GHz of A795 zoomed on the central extended radio emission, with JVLA 1.5 GHz contours, defined in Fig. 2.
Current usage metrics show cumulative count of Article Views (full-text article views including HTML views, PDF and ePub downloads, according to the available data) and Abstracts Views on Vision4Press platform.
Data correspond to usage on the plateform after 2015. The current usage metrics is available 48-96 hours after online publication and is updated daily on week days.
Initial download of the metrics may take a while.