Fig. 4.
Download original image
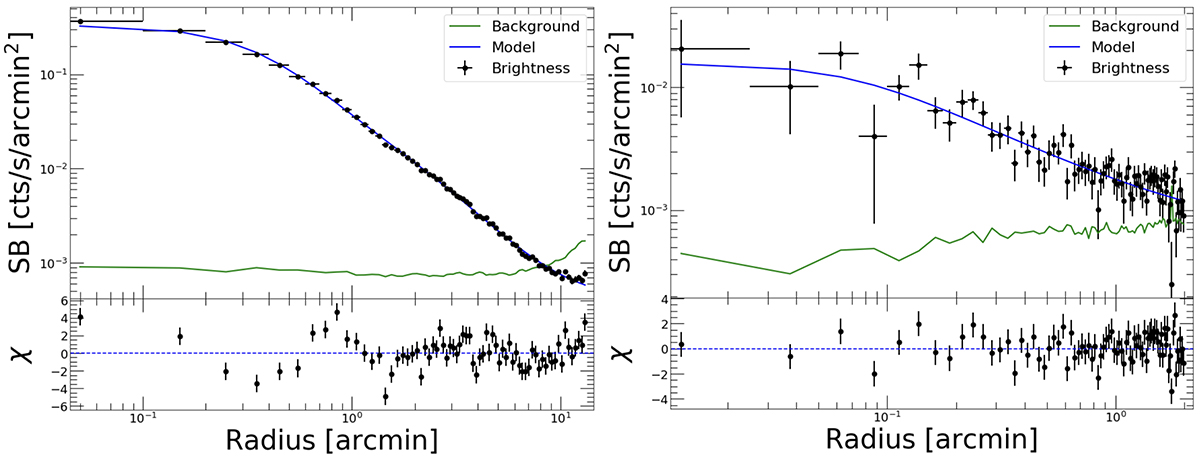
XMM-EPIC (0.5–2 keV) surface brightness profiles of the galaxy cluster A795 and the candidate galaxy group. Black points are the surface brightness measurements, while the green line represents the particle background. The lower panel shows the residuals from the best-fit model. Left panel: A795 profile fitted with a double β model. The best-fit parameters are reported in Table 2. Right panel: Surface brightness profile of the extended X-ray source 7.36′ northwest of A795, that we interpret as a candidate galaxy group at a similar redshift of A795 (see Sect. 3.2.2 and Fig. 3), fitted with a single β model. The best-fit parameters are reported in Table 2 (last row).
Current usage metrics show cumulative count of Article Views (full-text article views including HTML views, PDF and ePub downloads, according to the available data) and Abstracts Views on Vision4Press platform.
Data correspond to usage on the plateform after 2015. The current usage metrics is available 48-96 hours after online publication and is updated daily on week days.
Initial download of the metrics may take a while.