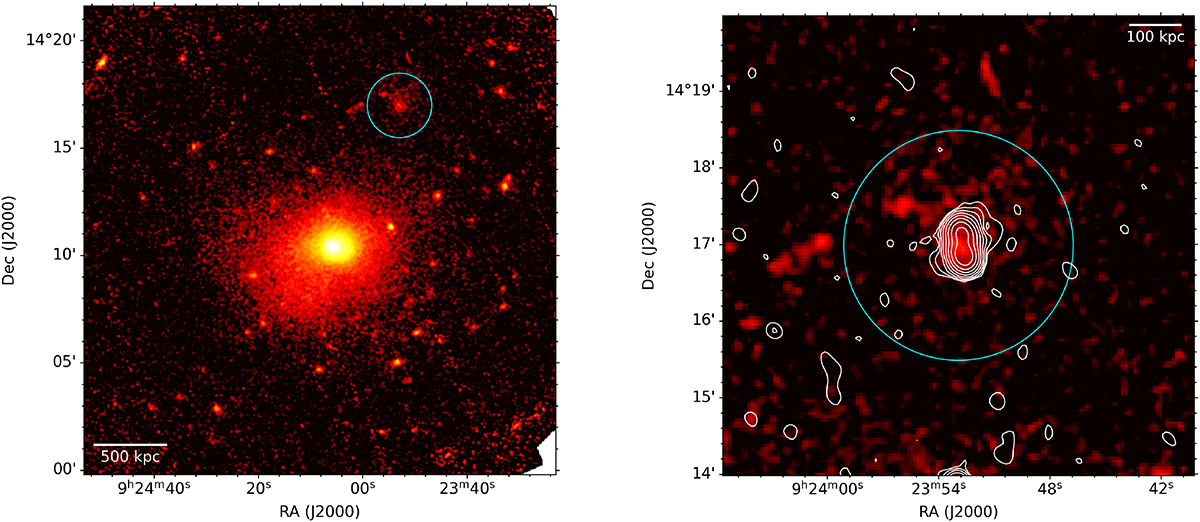
Fig. 3.
Download original image
XMM-EPIC (0.5–2 keV) exposure-corrected image Gaussian-smoothed with a kernel radius of 3 pixels shown on top, and below it, the optical image from the DESI survey. The cyan circle marks the position of an additional extended X-ray source (separate from the ICM of A795), see Sect. 3.2.2. The point sources detected are marked with white circles in left panel of Fig. 8. Top left panel: wide field view of A795. Top right panel: zoom-in on the extended X-ray source within the cyan circle in the left panel. The white contours are from the JVLA 1.5 GHz data (same as in right panel of Fig. 2). Bottom left panel: optical image from the DESI survey at the location of the extended X-ray source. The green squares mark the positions of four galaxies with similar spectroscopic redshift (from Rines et al. 2013), which are reported on the image. The light red contours are from the JVLA 1.5 GHz data (same as in right panel of Fig. 2). In each panel, the cyan circle has a radius of 1.5′, roughly corresponding to 200 kpc at the redshift of A795 (z = 0.1374).
Current usage metrics show cumulative count of Article Views (full-text article views including HTML views, PDF and ePub downloads, according to the available data) and Abstracts Views on Vision4Press platform.
Data correspond to usage on the plateform after 2015. The current usage metrics is available 48-96 hours after online publication and is updated daily on week days.
Initial download of the metrics may take a while.