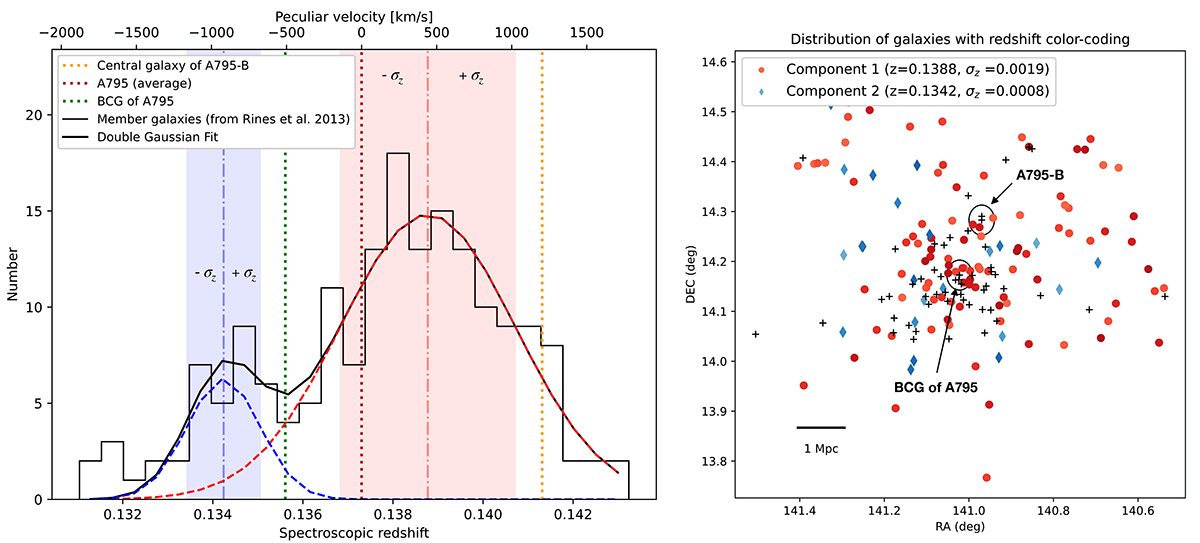
Fig. 10.
Download original image
Velocity distribution of member galaxies in A795. Left panel: histogram of the spectroscopic redshift (bottom x-axis) for 179 member galaxies of A795, measured and reported in Rines et al. (2013). The top x-axis shows the peculiar velocity relative to the average redshift of A795, that is z = 0.1374. Vertical dotted lines mark the central galaxy of A795-B (yellow), the average of A795 (red), and the BCG of A795 (green). The black solid line is the best-fit with a double Gaussian of the histogram, with the two components shown as blue and red dashed lines. The vertical dashed-dotted lines show the central velocity of each gaussian, while the shaded colored area represents the 1σ width of each Gaussian. Right panel: spatial distribution in RA and Dec of the member galaxies of A795 from Rines et al. (2013), color coded based on their peculiar velocity. Galaxies represented by red (blue) circles have peculiar velocity within ±1σ from the corresponding average of z = 0.1388 (z = 0.1342) shown in the left panel. Black + signs represent galaxies whose peculiar velocity falls outside the ±1σ range of both Gaussians in the left panel. The spatial position of the BCG of A795 and of the central galaxy of A795-B is highlighted, and both are plotted as with a black + sign.
Current usage metrics show cumulative count of Article Views (full-text article views including HTML views, PDF and ePub downloads, according to the available data) and Abstracts Views on Vision4Press platform.
Data correspond to usage on the plateform after 2015. The current usage metrics is available 48-96 hours after online publication and is updated daily on week days.
Initial download of the metrics may take a while.