Fig. 6.
Download original image
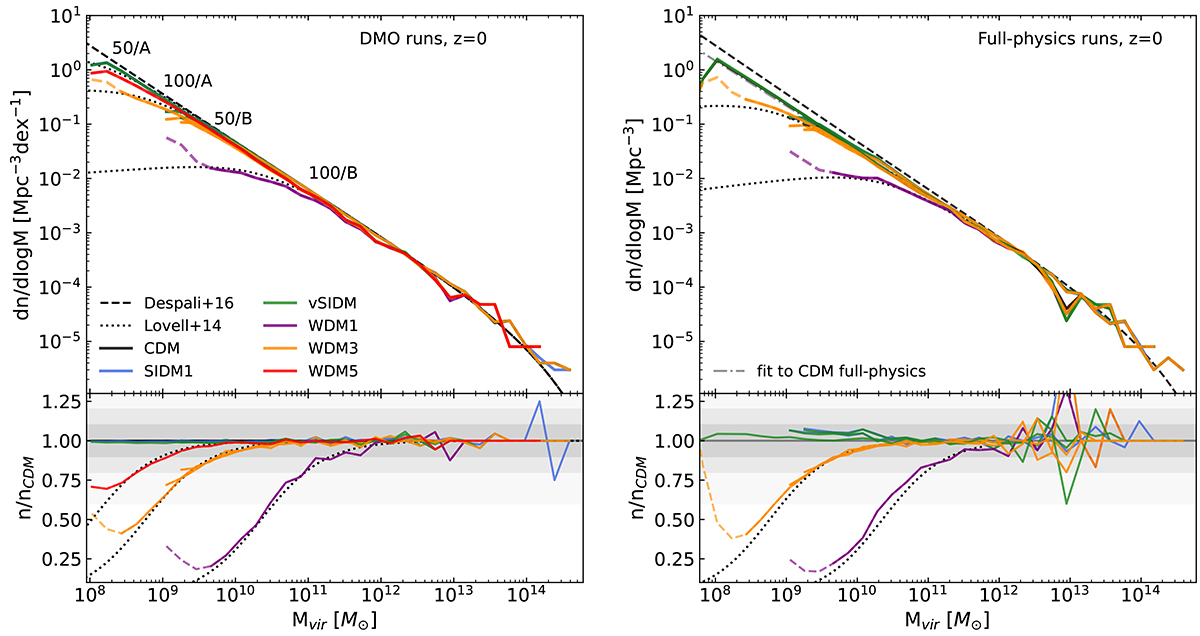
Halo mass function at z = 0 in the DMO (left) and FP (right) runs of the four simulation sets listed in Table 1. For each set, we only plot haloes with masses Mvir≥100 mDM, corresponding to increasingly smaller low-mass limits as indicated by the labels in the top-left panel. The smaller panels show the ratio of each model to CDM. The dashed black line gives the theoretical prediction calculated by Despali et al. (2016) – which agrees very well with the mass function measured in the DMO runs, while the dotted lines are calculated by applying to it the correction derived by Lovell et al. (2014). In the right panel, we also plot the CDM DMO mass function (black dashed line) to highlight the suppression generated by baryons at the low-mass end, compared to the DMO case. For the WDM runs, the transition between dashed and solid lines marks the limiting mass Mlim below which the runs are affected by artificial fragmentation.
Current usage metrics show cumulative count of Article Views (full-text article views including HTML views, PDF and ePub downloads, according to the available data) and Abstracts Views on Vision4Press platform.
Data correspond to usage on the plateform after 2015. The current usage metrics is available 48-96 hours after online publication and is updated daily on week days.
Initial download of the metrics may take a while.