Fig. 3.
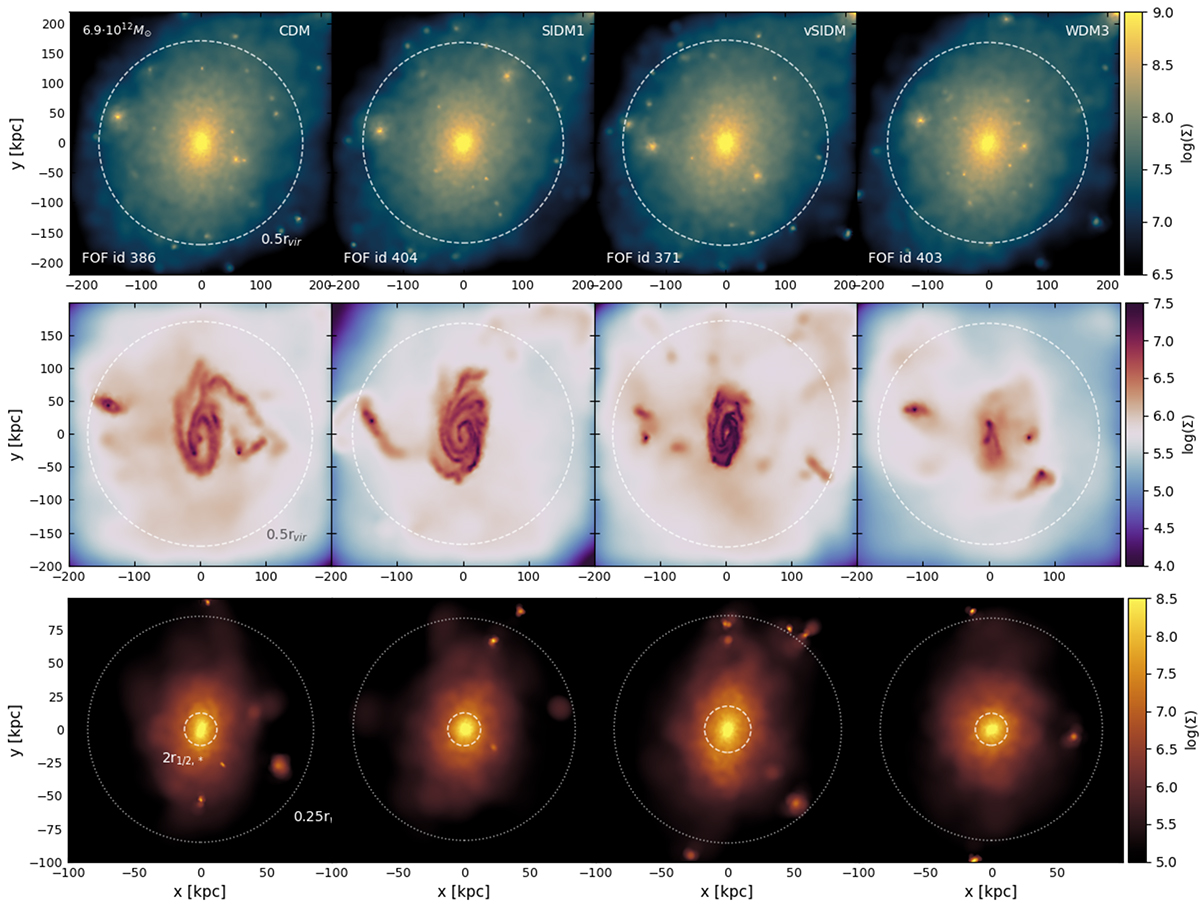
Download original image
Visualisation of the dark matter (top), gas (middle), and stellar (bottom) projected mass distributions in a Milky-Way mass halo (Mvir = 6.9×10¹² M⊙ in CDM at z = 0) from the 100/A runs. From left to right, CDM, SIDM1, vSIDM, and WDM3. We zoom-in to the central parts of the halo, ∼0.5 rvir in the top and middle panels, and ∼0.25 rvir in the stellar distribution. In the latter, we also mark the distance corresponding to twice the stellar half-mass radius. One can observe a decrease in the number of substructures in WDM3 as well as a clear difference in the gas dynamics and the shape of the stellar distribution.
Current usage metrics show cumulative count of Article Views (full-text article views including HTML views, PDF and ePub downloads, according to the available data) and Abstracts Views on Vision4Press platform.
Data correspond to usage on the plateform after 2015. The current usage metrics is available 48-96 hours after online publication and is updated daily on week days.
Initial download of the metrics may take a while.