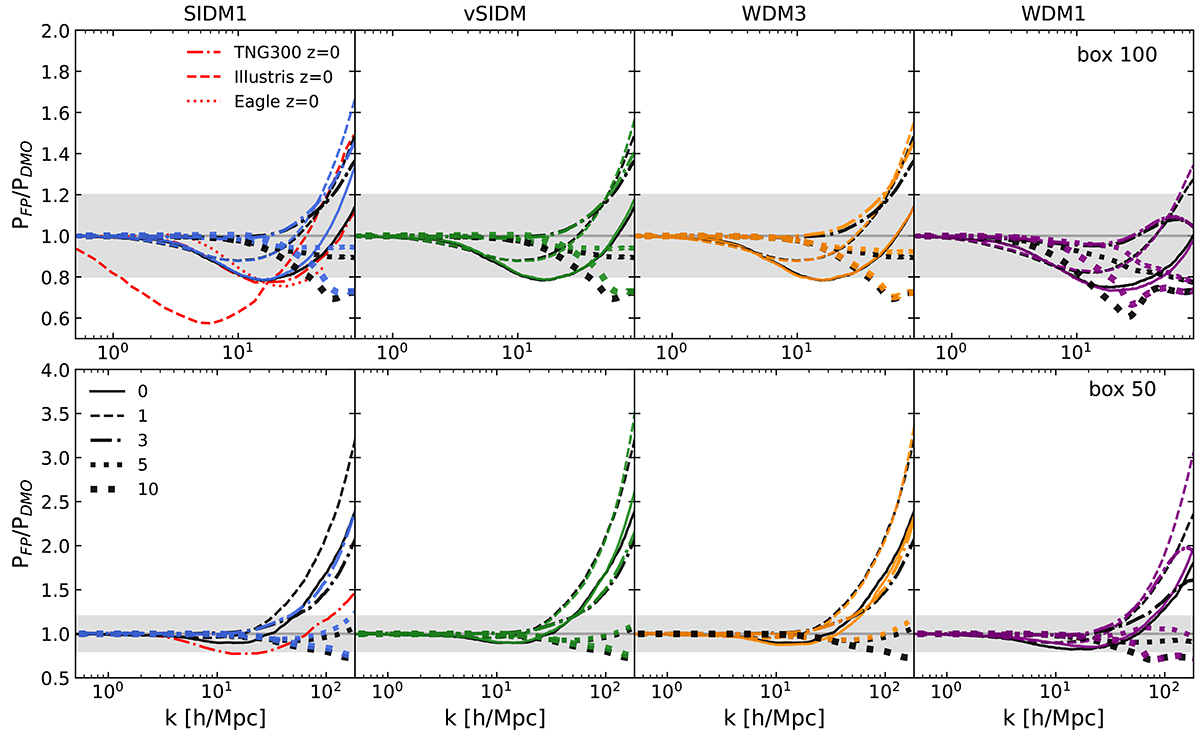
Fig. 16.
Download original image
Baryonic effects on the total matter power-spectrum measured at five different redshifts from z = 0 to z = 10. Here we plot the P(k) ratio of the FP run of each model to its corresponding DMO one. Each column considers one alternative model (coloured lines of different styles) and contrasts it with the CDM result at the same redshift (black lines). In the top (bottom) panels, we look at the 100/A (50/A) boxes. We see how the smaller box allows us to reach higher k values and larger enhancements of the power spectrum due to the baryons located at the very centre of haloes. The power spectrum of the WDM1 model (rightmost panels) is measured in the 100/B and 50/B boxes and compared to the corresponding CDM case – the reason why the black curves differ in the right panel. The grey bands mark a difference within 20% from the DMO value. In the leftmost panels, we also compare to previous results at z = 0 from the Illustris, TNG300 (Springel et al. 2018) and Eagle (Hellwing et al. 2016) simulations.
Current usage metrics show cumulative count of Article Views (full-text article views including HTML views, PDF and ePub downloads, according to the available data) and Abstracts Views on Vision4Press platform.
Data correspond to usage on the plateform after 2015. The current usage metrics is available 48-96 hours after online publication and is updated daily on week days.
Initial download of the metrics may take a while.