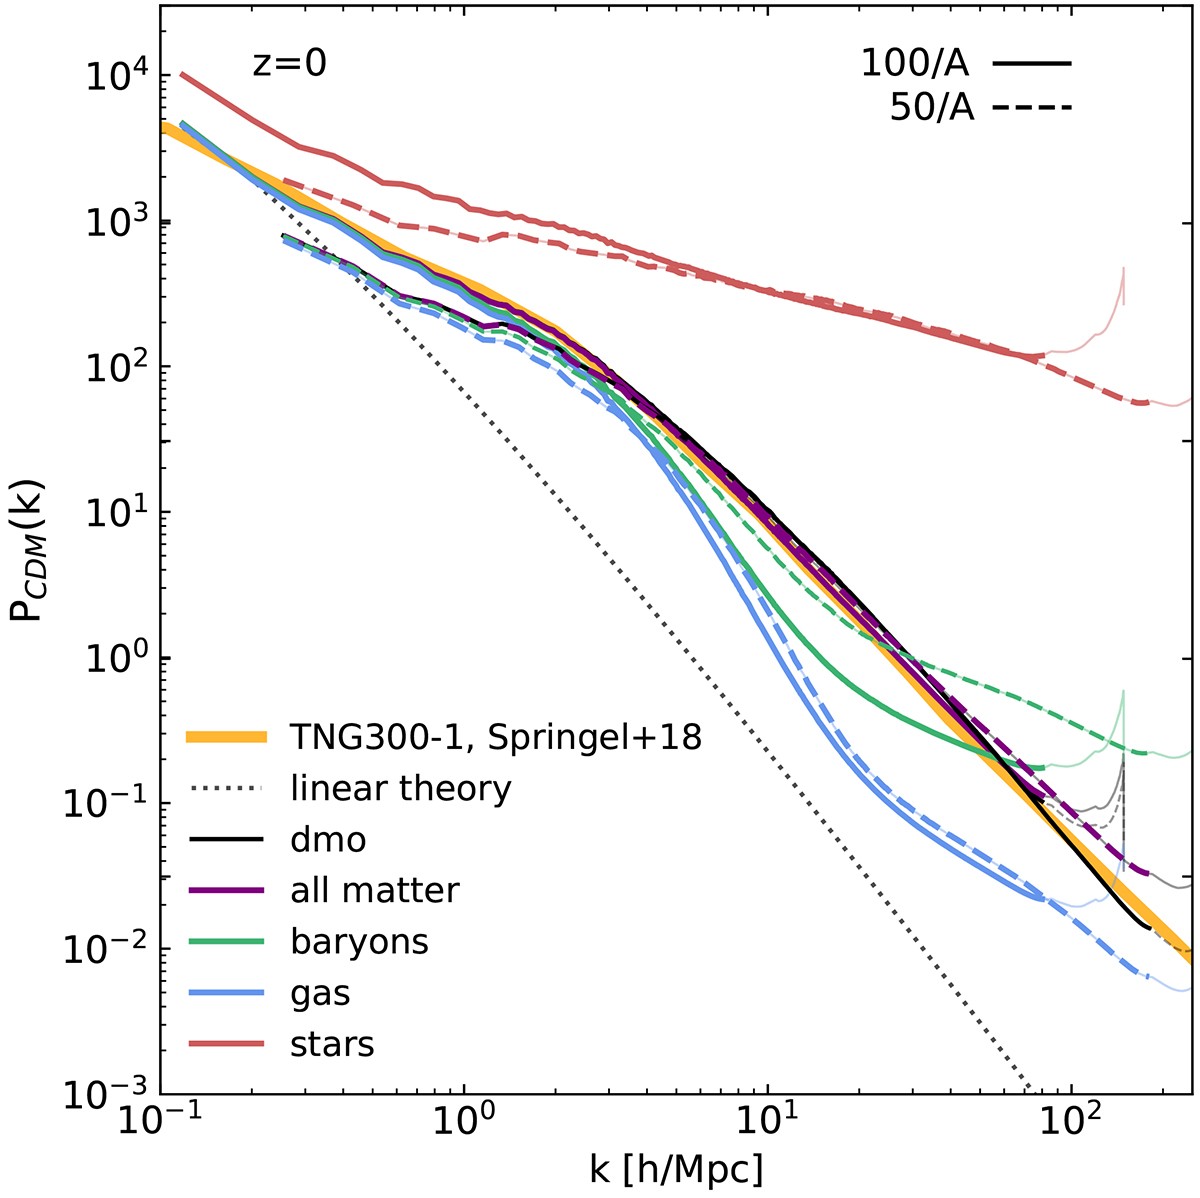
Fig. 15.
Download original image
Matter power spectrum in the CDM runs at z = 0 for the DMO (black) and the FP runs separated into different components (coloured curves). The dotted lines show the prediction from linear theory, while the yellow line shows the result from Springel et al. (2018) for the larger TNG300-1 box. We used the two high-resolution boxes, 100/A (solid lines) and 50/A (dashed lines). All power spectra are computed with a grid of size 20483, leading to Nyquist frequencies for the two cases of k = 85.8 h Mpc−1 and k = 183 h Mpc−1, respectively. Here and in the following figures, we used these values to limit the curves and plot the remaining points as a fainter line.
Current usage metrics show cumulative count of Article Views (full-text article views including HTML views, PDF and ePub downloads, according to the available data) and Abstracts Views on Vision4Press platform.
Data correspond to usage on the plateform after 2015. The current usage metrics is available 48-96 hours after online publication and is updated daily on week days.
Initial download of the metrics may take a while.