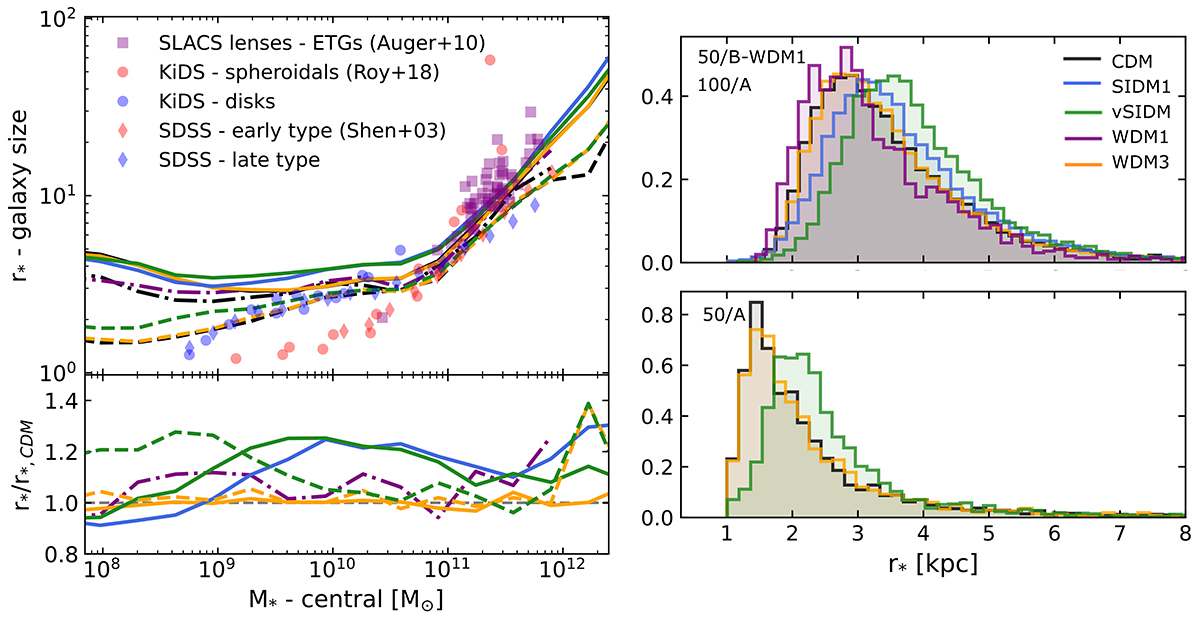
Fig. 14.
Download original image
Left: Galaxy sizes expressed in terms of r* as a function of the galaxy stellar mass at z = 0. The ratios of alternative models to CDM (bottom subpanel) show us that SIDM models produce larger galaxies in most mass bins (see also the bottom panel of Fig. 4 as an example). We show the running mean for the 50/A (dashed), 100/A (solid) and 50/B (dot-dashed) runs, the latter only to represent the WDM1 model. We compare simulated results to observational values from the SLACS strong gravitational lenses (ETGs Auger et al. 2010), galaxies (spheroidal and disk) from the KiDS survey (Roy et al. 2018) and from the SDSS (early and late type) survey (Shen et al. 2003). We note, however, that the galaxy size is estimated as the projected half-light radius in observations while we plot the stellar half-mass radius, and the observed galaxies are at different redshifts. They are thus only meant to provide a qualitative comparison. Right: Full normalised distribution of sizes highlighting the lack of galaxies with small sizes in SIDM models.
Current usage metrics show cumulative count of Article Views (full-text article views including HTML views, PDF and ePub downloads, according to the available data) and Abstracts Views on Vision4Press platform.
Data correspond to usage on the plateform after 2015. The current usage metrics is available 48-96 hours after online publication and is updated daily on week days.
Initial download of the metrics may take a while.