Fig. 13.
Download original image
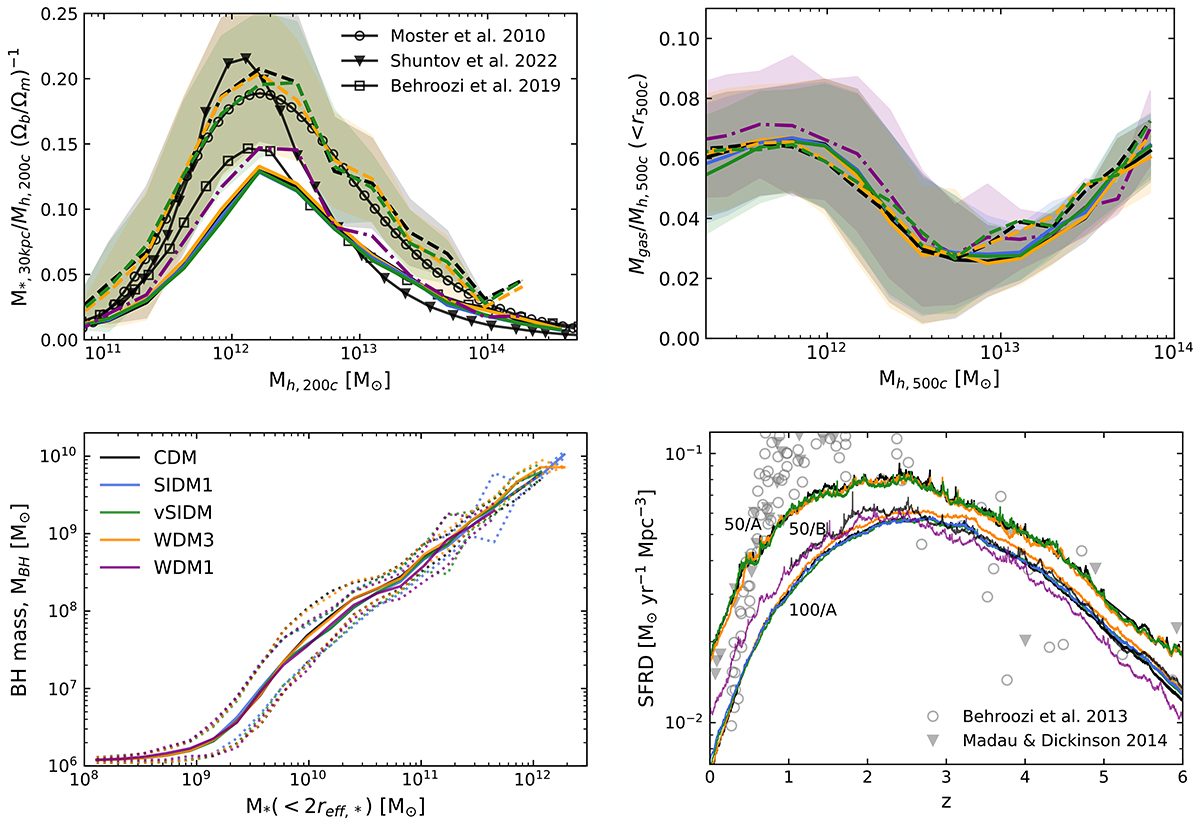
Quantitative tests of the TNG galaxy formation model in all dark matter scenarios at z = 0. We focus on some of the quantities that have been used in the design of the TNG model (see Pillepich et al. 2018a) together with the stellar mass function (Fig. 9) and the galaxy sizes (Fig. 14). The colour-correspondence to the dark matter model is the same in all panels. Top left: Stellar-mass halo-mass relation. Here, M* is measured within 30 kpc from the centre. The black dotted curves show empirical estimates based on CDM and the model by Moster et al. (2010), Behroozi et al. (2019) and Shuntov et al. (2022), while the coloured curves show the results from our simulations, represented by running mean and standard deviations for each dark matter scenario. Top right: Gas fraction of haloes within r500c. Bottom left: Central SMBH mass as a function of the stellar mass (here calculated within twice the stellar half-mass radius r*) for all subhaloes at z = 0. The dotted lines mark the 1σ region. Bottom right: Cosmic SFRD as a function of redshift compared qualitatively to observational measurements by Behroozi et al. (2013), Madau & Dickinson (2014).
Current usage metrics show cumulative count of Article Views (full-text article views including HTML views, PDF and ePub downloads, according to the available data) and Abstracts Views on Vision4Press platform.
Data correspond to usage on the plateform after 2015. The current usage metrics is available 48-96 hours after online publication and is updated daily on week days.
Initial download of the metrics may take a while.