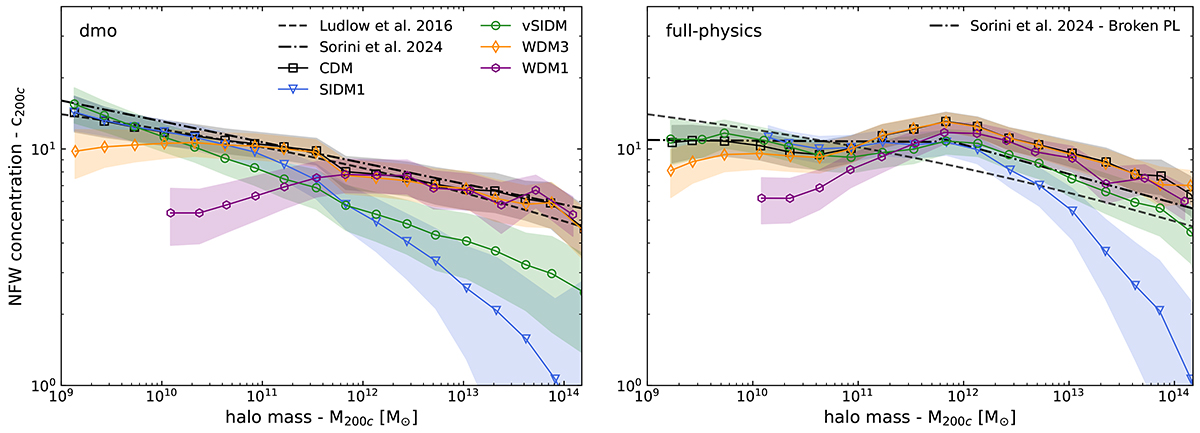
Fig. 12.
Download original image
Concentration-mass relation at z = 0 for haloes in the DMO (left) and FP (right) runs. We combine measurements from the 50/A and 100/A boxes, using the latter only for haloes with a mass M200c≥1011 M⊙. The coloured lines and symbols show the mean concentration as a function of mass, together with the 1-σ uncertainty represented by the bands of the corresponding colour. The dashed and dashed-dotted black lines show the previous work by Ludlow et al. (2016) and Sorini et al. (2024) on CDM simulations instead. The latter used the IllustrisTNG and MillenniumTNG, which also employ the TNG galaxy formation model, and provided a broken-power-law fit for the FP runs, which we show here in the right panel.
Current usage metrics show cumulative count of Article Views (full-text article views including HTML views, PDF and ePub downloads, according to the available data) and Abstracts Views on Vision4Press platform.
Data correspond to usage on the plateform after 2015. The current usage metrics is available 48-96 hours after online publication and is updated daily on week days.
Initial download of the metrics may take a while.