Fig. 7
Download original image
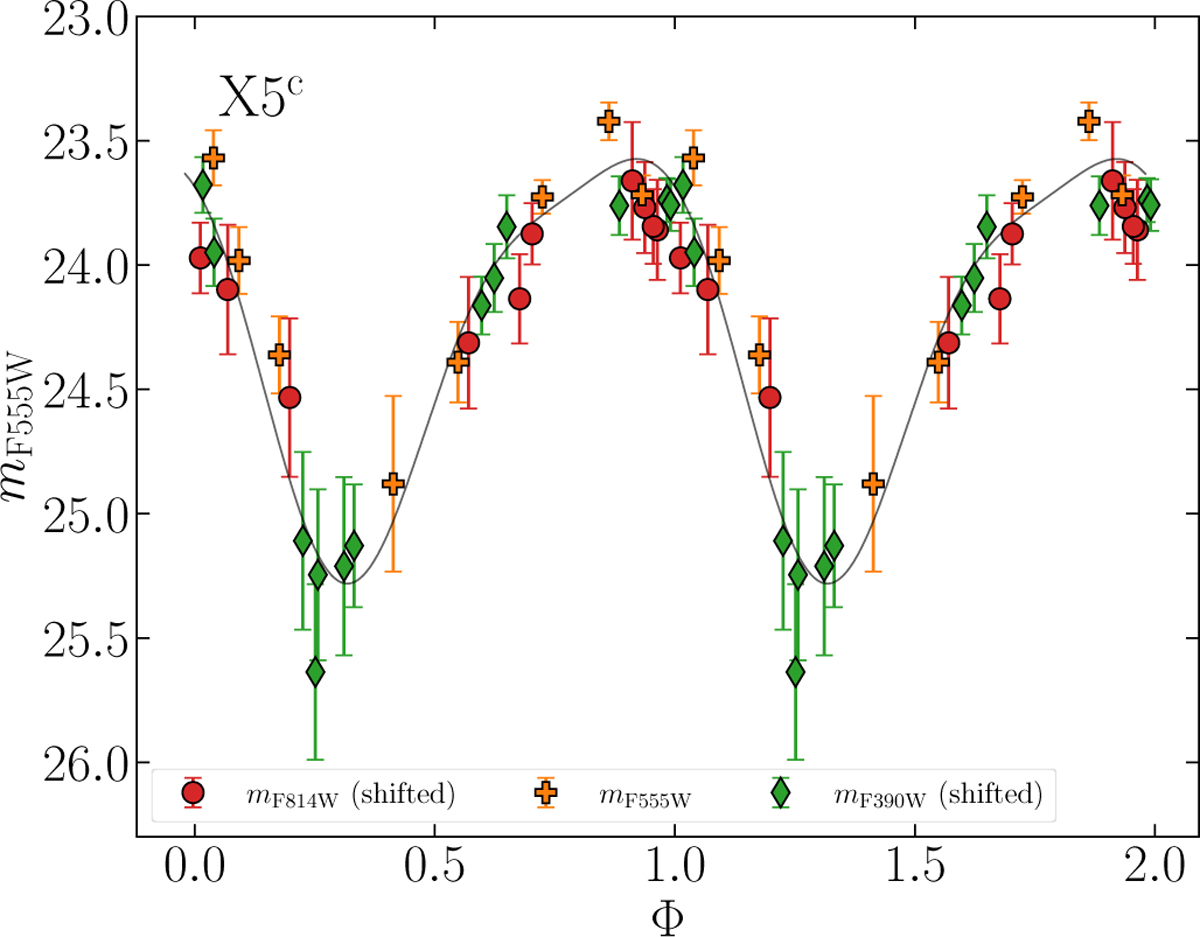
Global light curve of one candidate counterpart to the X5 source (object marked in blue in Fig. 6) obtained by combining the data points from F390W, F555W, and F814W WFC3 images (in green, orange and red respectively). The light curve is folded with a period of 5.08 hours, obtained from the Lomb-Scargle analysis. The grey solid line, a combination of sines and cosines fitted to the data points. It has no physical meaning, it is plotted only to facilitate the visualisation of the curve.
Current usage metrics show cumulative count of Article Views (full-text article views including HTML views, PDF and ePub downloads, according to the available data) and Abstracts Views on Vision4Press platform.
Data correspond to usage on the plateform after 2015. The current usage metrics is available 48-96 hours after online publication and is updated daily on week days.
Initial download of the metrics may take a while.